8.1 HUMAN POPULATIONS
📌 Definitions Table
| Term | Definition |
|---|---|
| Immigrants | Individuals who move permanently to a country other than their country of origin. |
| Ageing Population | A demographic trend where the proportion of people aged 65 and older increases, often due to longer life expectancy and declining birth rates. |
| Diversifying the Economy | Expanding economic activities across multiple sectors to reduce dependency on a single industry and increase resilience. |
| Young Dependants | Individuals typically aged 0–14 who rely on the working population for support. |
| Old Dependants | Individuals typically aged 65 and above who are retired and depend on the working population for support. |
| Economically Active | People typically aged 15–64 who are part of the labor force, contributing to economic productivity through work. |
- 🧠 Exam Tips:
In population structure questions, use age-based terms precisely and mention dependency ratio if relevant.
For economic diversification, mention its role in sustainability and resilience when elaborating.
📌 Human Population Dynamics
Inputs to human populations: births and immigration
- Births and immigration are inputs that contribute to the growth of a population
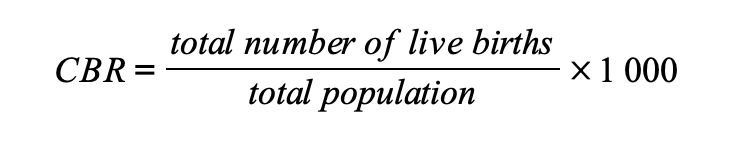
- Crude birth rate (CBR):
- This is the number of live births per 1 000 people in a population per year
- For example, a CBR of 15 means 15 babies are born for every 1 000 people in that population each year
- CBR is calculated by dividing the total number of live births in a year by the total population and then multiplying by 1 000
- This is the number of live births per 1 000 people in a population per year
Worked Example
A country has 25 000 live births in a year, and the total population is 500 000.
Calculate the crude birth rate.
Answer
CBR = (number of live births / total population) x 1 000
CBR = (25 000 / 500 000) x 1 000
CBR = 50 births per 1 000 individuals
- Immigration rate:
- This is the number of immigrants per 1 000 people in a population per year
Outputs from human populations: deaths and emigration
- Deaths and emigration are outputs that reduce the size of a population
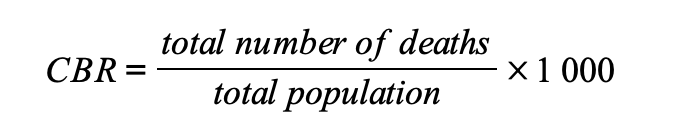
- Crude death rate (CDR):
- This is the number of deaths per 1 000 people in a population per year
- For example, a CDR of 8 means 8 people die for every 1 000 people in that population each year
- CDR is calculated by dividing the total number of deaths in a year by the total population and then multiplying by 1 000
- This is the number of deaths per 1 000 people in a population per year
Worked Example
In a given year, a country recorded 15 000 deaths, and the total population is 750 000.
Calculate the crude death rate.
Answer
CDR = (number of deaths / total population) x 1 000
CDR = (15 000 / 750 000) x 1 000
CDR = 20 deaths per 1 000 individuals
- Emigration rate:
- This measures the number of people leaving a population per 1 000 people per year
Quantifying population dynamics
- Population growth and decline can be quantified through several key measures:
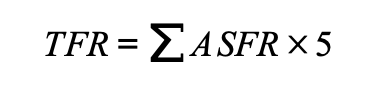
- Total fertility rate (TFR):
- This is the average number of children a woman is expected to have during her lifetime, based on current age-specific fertility rates
- In developing countries, TFR tends to be higher (e.g. due to limited access to family planning)
- TFR is calculated by summing the age-specific fertility rates (ASFR) and multiplying the result by five
- This is the average number of children a woman is expected to have during her lifetime, based on current age-specific fertility rates
Worked Example
A country has the following fertility rates per 1 000 women in each age group:
- 15-19 years: 20 births per 1 000 women
- 20-24 years: 85 births per 1 000 women
- 25-29 years: 100 births per 1 000 women
- 30-34 years: 80 births per 1 000 women
- 35-39 years: 40 births per 1 000 women
- 40-44 years: 10 births per 1 000 women
- 45-49 years: 2 births per 1 000 women
Calculate the total fertility rate.
Answer
TFR = (20 + 85 + 100 + 80 + 40 + 10 + 2) x 5
TFR = 1 685 births per 1 000 women
TFR = 1.685 children per woman
This means that, on average, a woman in this country is expected to have approximately 1.69 children over her lifetime based on current fertility rates.
- Life expectancy:
- This is the average number of years a person is expected to live from birth, assuming current demographic factors (such as healthcare) remain the same
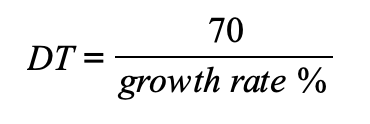
- Doubling time (DT):
- This is the number of years it would take a population to double in size, based on its current growth rate
- DT is calculated using the ‘rule of 70’: divide 70 by the population growth rate percentage
Worked Example
A population has a growth rate of 2% per year.
Calculate the doubling time.
Answer
DT = 70 / growth rate
DT = 70 / 2
DT = 35 years
- Natural increase rate (NIR):
- This is the difference between the crude birth rate and crude death rate, usually expressed as a percentage or a number per 1 000.
- If the birth rate is higher than the death rate, natural increase occurs
- NIR is calculated by subtracting the CDR from the CBR and then dividing the result by 10
- This is the difference between the crude birth rate and crude death rate, usually expressed as a percentage or a number per 1 000.
Worked Example
A country has a CBR of 25 births per 1 000 individuals and a CDR of 10 deaths per 1 000 individuals.
Calculate the natural increase rate.
Answer
NIR = (CBR – CDR) / 10
NIR = (25 – 10) / 10
NIR = 1.5%
Rapid growth of the global human population
- The global human population has followed a rapid growth curve, particularly in the past century
- The global human population grew very slowly until 18th century
- From 10 000 BCE to 1700 CE, the average growth rate was just 0.04% per year
- There has been exponential growth in the global human population since the mid 18th century
- In 1800, the world population was about 1 billion
- By 2024, the population will have grown to over 8 billion
- This growth is largely due to improvements in medicine, agriculture and technology, which have reduced death rates
- The growth rate is starting to fall again
- However, the world population is projected to continue to grow until approximately 2100, when it could reach more than 11 billion
UN projection models
- The United Nations (UN) uses models to project future global population growth, offering three different scenarios:
- High-fertility scenario: assumes higher birth rates will continue, leading to a more rapid population increase
- Medium-fertility scenario: assumes a steady decline in fertility rates, leading to moderate population growth (this is the most likely scenario)
- Low-fertility scenario: assumes fertility rates will drop significantly, leading to slower growth or a shrinking population
- By 2100, the global population is projected to be around 9.7 billion in the medium-fertility scenario
Uncertainty of future fertility rates
- Predicting fertility rates is challenging, leading to uncertainty in population forecasts
- Changes in cultural norms, economic conditions, and government policies can all influence fertility rates
- Countries that went through Industrial Revolutions in the 18th and 19th centuries experienced rapid populationgrowth
- Today those countries are developed and their growth rates have fallen
- In some cases, they have fallen so much that their total populations are in decline (e.g. Japan)
- The fastest population growth today occurs in developing countries that are rapidly industrialising
📌 Managing Human Population Growth
Direct management of population growth
- Population management involves policies aimed at influencing the size, growth and distribution of human populations
- These policies focus on birth rates (pro-natalist or anti-natalist) or on migration (immigration and emigration).
- Governments use these policies to address concerns such as:
- Overcrowding
- Economic demands
- Ageing populations
Anti-natalist policies
- Anti-natalist policies reduce birth rates in countries with high population growth
- These policies are common in countries facing overpopulation, where resources are strained
Methods used
- Education and awareness: promoting smaller family sizes and the benefits of fewer children
- For example, China’s One-Child Policy (introduced in 1979) aimed to slow population growth by limiting families to one child
- Access to contraception: improving the availability of birth control methods to reduce unwanted pregnancies
- For example, in India, family planning campaigns have included the distribution of free contraceptives
- Financial incentives: offering financial rewards or penalties to influence family size
- For example, Vietnam’s Two-Child Policy (introduced in the 1980s) aimed to limit family size by encouraging people to have only two children
- The policy was supported by:
- Financial penalties for larger families
- Incentives such as preferential housing and education benefits for those who complied
Outcomes
- Anti-natalist policies lead to:
- Slower population growth
- Reduced pressure on resources
- However, they can also cause long-term issues, such as an ageing population (fewer young people to support the elderly)
Pro-natalist policies
- Pro-natalist policies encourage an increase in birth rates in countries with low or negative population growth
- These policies are used in countries facing ageing populations or labour shortages
Methods used
- Financial incentives: offering parents monetary support for having more children
- For example, France’s Code de la Famille (1939) offers cash bonuses, paid parental leave and subsidised childcare to encourage larger families
- Parental support: providing benefits such as longer parental leave or free childcare
- For example, Sweden offers generous parental leave (up to 480 days shared between both parents) to support family growth
- Cultural encouragement: promoting family-friendly values through campaigns or media
Outcomes
- Pro-natalist policies help to:
- Boost population growth
- Ensure a balanced ratio between working-age individuals and the elderly
- However, they may take time to show effects and could face cultural resistance
Migration policies
- Migration policies manage immigration (inward) and emigration (outward) to influence population size and labour markets
- Countries may encourage or restrict migration based on economic needs and population growth goals
Methods used
- Open immigration policies: allowing more people to enter the country, particularly if there is a need for workers
- For example, Germany has encouraged immigration to offset its declining population and labour shortages
- Restrictions on immigration: limiting the number of people who can enter a country to control population growth or preserve jobs for citizens
- For example, Australia has a strict immigration policy based on points
- This points-based system favours skilled workers
- For example, Australia has a strict immigration policy based on points
- Encouraging emigration: some countries promote emigration to relieve population pressure
Outcomes
- Immigration can help to:
- Balance an ageing population
- Provide labour
- Diversify the economy
- Emigration can reduce population pressure, but may lead to a ‘brain drain’, where skilled workers leave the country
Indirect management of population growth
- Indirect population management involves policies that do not directly aim to control population growth but still affect factors such as birth rates, death rates and migration
- These policies focus on economic, social, health and development areas
- These policies indirectly influence population dynamics
Economic policies
- Economic policies influence population growth by:
- Improving living standards
- Changing family planning decisions
- In less wealthy societies, families feel economic pressure to have more children because:
- Children contribute to family income: in many rural or low-income areas, children may work on farms or help with small businesses, providing extra income for the family
- Lack of social welfare: without government support like pensions or healthcare, parents may rely on their children to support them in old age
- Higher child mortality rates: in areas with poor healthcare, parents may have more children to ensure that some survive to adulthood
- Limited access to education: with fewer opportunities for higher education, children are often seen as a source of immediate labour and support, rather than an investment for the future
- Wealthier societies tend to have lower birth rates, as families may prefer to invest more in fewer children
Methods used
- Job creation and economic stability: improved employment opportunities can reduce poverty
- This leads to fewer children as families focus on education and careers
- Welfare systems: governments that provide strong social welfare systems help families feel secure with fewer children
Outcomes
- Higher living standards often lead to lower birth rates, as families feel less economic pressure to have many children
- Economic development can slow population growth as people focus more on career and lifestyle choices over family size
Social and gender equality policies
- Policies that promote gender equality and social development indirectly reduce birth rates
- This is because these types of policies empower women to make informed family planning decisions
Methods used
- Education for girls and women: increasing access to education leads to delayed marriages and childbirth, as well as smaller family sizes
- Workforce participation: encouraging women to join the workforce allows them to focus on careers
- This often leads to smaller families and later pregnancies
Outcomes
- Improved gender equality leads to more choices for women, resulting in lower birth rates
- Societies with greater gender equality have higher levels of education and economic participation, both of which can reduce population growth.
Public health and welfare policies
- Health policies affect population growth by lowering death rates and improving overall well-being
- Both of these can influence birth rates
Methods used
- Improved healthcare: providing better healthcare, especially maternal and child health services, reduces infant mortality
- This can lead to smaller family sizes
Outcomes
- Better healthcare reduces both death and birth rates, leading to more stable population growth
📌 Population Composition & Modelling
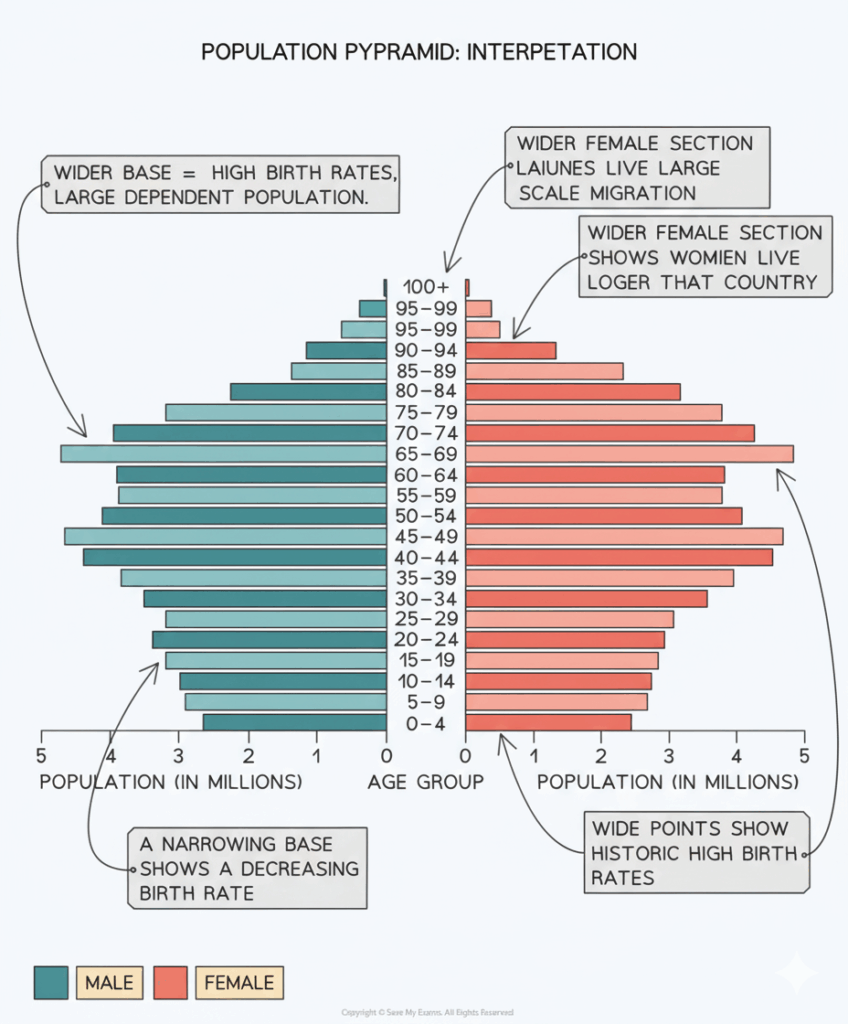
Age-sex pyramids
- The composition of human populations can be modelled and compared using age–sex pyramids
- These are sometimes referred to as population pyramids, age-gender pyramids or age structure diagrams
- An age–sex pyramid is a graphical representation of a population’s ageandsexstructure
- It displays the percentage or number of individuals in each age group and gender within a given population
- They typically show data for a particular country or region
- The age–sex pyramid is usually represented as a horizontal bar graph
- The age groups are displayed along the vertical axis
- The percentage or number of individuals in each age group is displayed along the horizontal axis
- The left side of the graph displays the male population
- The right side shows the female population
- The shape of the age–sex pyramid can provide insights into the demographic characteristics of a population
- For example, a pyramid with a broad base and a narrow top indicates a young population with high fertility rates and low life expectancy
- Whereas a pyramid with a narrow base and a broad top indicates an ageing population with low fertility rates and high life expectancy
- Age–sex pyramids are used by policymakers and economists to:
- Understand population trends
- Forecast future population growth
- Plan for social and economic policies
- They are also used in fields such as public health, education and social welfare to plan for the needs of specific age groups within a population
- This means that governments can estimate and plan for spending
- An age–sex pyramid can be used to identify the following groups:
- Young dependents
- Old dependents
- Economically active (working population)
Population structures of LICs and HICs

- Low-income countries (LICs) like Niger typically have a concave pyramid shape
- This indicates:
- High birth rate
- Low life expectancy
- High death rate
- High infant mortality rate
- Young dependent population dominates

- More developed LICs like Nepal typically have a pyramid shape with a taller base, like the one shown above
- This indicates:
- Decreasing birth rate
- Increasing life expectancy
- Decreasing death rate
- Decreasing infant mortality
- Decreasing young dependents and increasing economically active population
- High-income countries (HICs) such as the USA typically have a column shape
- This indicates:
- Low birth rate
- High life expectancy
- Low death rate
- Low infant mortality
- Large working age population
Demographic transition model (DTM)
- The DTM is a model that shows how a population transitions over time:
- From a pre-industrial stage, with high crude birth rates and high crude death rates
- To an economically advanced stage, with low or declining crude birth rates and low crude death rates
- The DTM illustrates five generalised stages that countries pass through as they develop
- It shows how the birth and death rates change and how this affects the overall population of the country
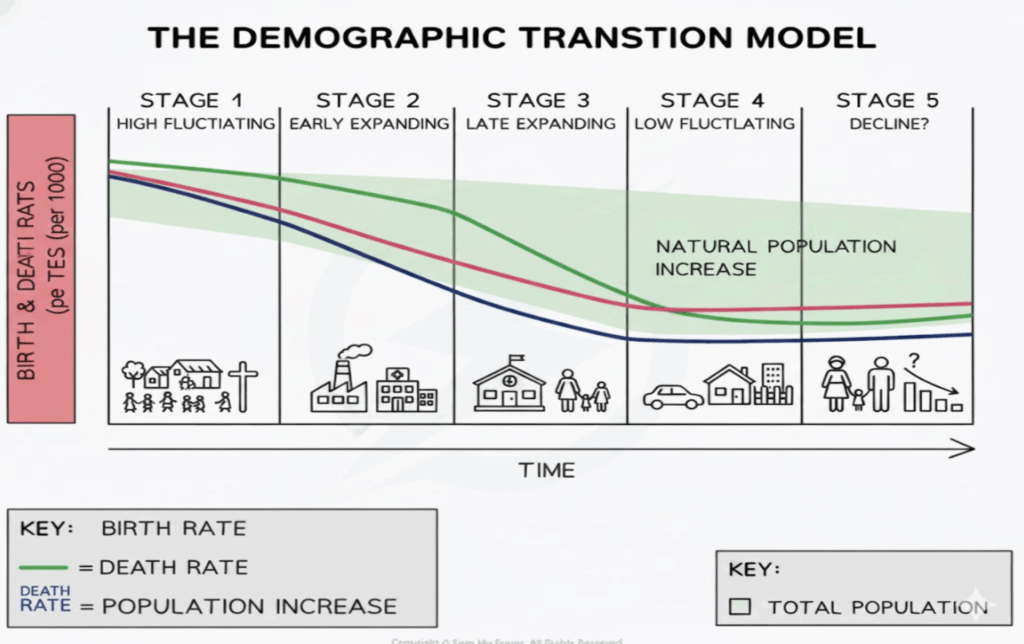
Stage 1
- The total population is low
- High birth rates due to lack of contraception and family planning
- High death rates due to poor healthcare, poor diet and famine
- High infant mortality, which leads people to have more children so that some children survive to adulthood
Stage 2
- The total population starts to rise rapidly
- Birth rates remain high as people continue to have large families
- Death rates decrease as a result of improved diets, better healthcare, lower infant mortality and increased access to clean water
Stage 3
- The total population continues to increase but the rate of growth begins to slow
- Birth rate begins to fall rapidly due to increased birth control, family planning, increased cost of raising children and low infant mortality rate
- Death rate still decreasing but at a slower rate as improvements in medicine, hygiene, diet and water quality continue
Stage 4
- The total population is high and is increasing slowly
- Birth rate is low and fluctuating due to accessible birth control and the choice of having fewer children as well as delaying the age women start to have children
- Death rate is low and fluctuating
Stage 5
- The total population starts to slowly decline as the death rate exceeds the birth rate
- Birth rate is low and slowly decreasing
- Death rate is low and fluctuating