2.1 INDIVIDUALS, POPULATIONS, COMMUNITIES, AND ECOSYTEMS
📌 Definitions Table
| Term | Definition |
|---|---|
| Species | A group of organisms that can interbreed to produce fertile offspring. |
| Population | A group of organisms of the same species living in the same area at the same time. |
| Habitat | The physical environment or location in which a species normally lives. |
| Niche | The role and position a species has in its environment, including interactions and resource use. |
| Community | All populations of different species living and interacting in a common habitat. |
| Ecosystem | A community of organisms and their abiotic environment interacting as a system. |
| Biotic Factors | Living components of an ecosystem that affect other organisms (e.g., predation, competition). |
| Abiotic Factors | Non-living physical and chemical components of an ecosystem (e.g., temperature, pH, light). |
| Producer (Autotroph) | An organism that converts light or chemical energy into biomass through photosynthesis or chemosynthesis. |
| Consumer (Heterotroph) | An organism that obtains energy by feeding on other organisms. |
| Decomposer | Organisms (e.g., bacteria, fungi) that break down dead organic matter, recycling nutrients back into the ecosystem. |
| Trophic Level | The position an organism occupies in a food chain, based on feeding relationships. |
| Food Chain | A linear sequence showing the flow of energy from one organism to the next through feeding. |
| Food Web | A complex network of interlinked food chains showing energy flow within an ecosystem. |
| Biomass | The total mass of living or recently living organisms in a given area or trophic level. |
| Gross Primary Productivity (GPP) | The total amount of solar energy converted by producers into chemical energy through photosynthesis. |
| Net Primary Productivity (NPP) | The energy remaining after producers have used some through respiration (NPP = GPP − R). |
| Net Secondary Productivity (NSP) | The energy gained by consumers after respiration losses (NSP = GSP − R). |
| Respiration (R) | The process by which organisms convert glucose into usable energy, releasing CO₂ and water. |
| Photosynthesis | The process by which green plants use sunlight to convert CO₂ and water into glucose and oxygen. |
| Carrying Capacity | The maximum population size of a species that an environment can sustainably support. |
| Limiting Factor | A factor that restricts the growth or distribution of a population within an ecosystem. |
| Intraspecific Competition | Competition between individuals of the same species for resources. |
| Interspecific Competition | Competition between individuals of different species for shared resources. |
| Parasitism | A relationship where one organism (parasite) benefits at the expense of another (host). |
| Mutualism | A symbiotic relationship where both species benefit. |
| Succession | A natural process of change in ecosystem structure and species composition over time. |
| Zonation | Spatial variation in species distribution due to environmental gradients, such as altitude or salinity. |
- 🧠 Exam Tips:
Use key terms like “interaction,” “energy flow,” “trophic,” “resources,” and “abiotic/biotic” where appropriate.
Include formulas where applicable (e.g., NPP = GPP − R) in productivity-related questions.
Always differentiate terms like population vs community or GPP vs NPP when both appear in the same question.
📌 Introduction to Ecological Systems
The biosphere
- The biosphere refers to the narrow, life-supporting zone around the Earth
- It is where the air (atmosphere), water (hydrosphere) and land (lithosphere) meet
- The biosphere contains all living organisms, including:
- Plants (flora)
- Animals (fauna)
- Fungi and microorganisms
- It can be thought as one large, complex system of living communities, as well as their interactions with each other and with the non-living components of the Earth’s systems, all interacting as a single unit
Species
- A species is a group of organisms sharing common characteristics that interbreed to produce fertile offspring
- This is known as the biological species concept
- Members of the same species share a gene pool, meaning that they can breed and produce offspring with similar traits
Populations
- A population is a group of organisms of the same species living in the same area at the same time which interbreed
- A population can be seen as an interbreeding unit of a species
- One species may consist of any number of populations, from one to many—for example:
- The Eastern Grey Kangaroo is a species of marsupial native to Australia
- This species consists of multiple populations across various regions of Australia
- There are populations of Eastern Grey Kangaroos in Queensland, New South Wales, Victoria and other parts of the country
- Although individuals from these different populations are capable of interbreeding, in reality they very rarely do due to the fact that they are geographically isolated (separated) from each other
- Each population may have its own unique characteristics and adaptations based on local factors such as habitat, climate and food availability
- Despite being part of the same species, these populations may exhibit some small genetic and behavioural differences due to their isolation and local environmental conditions
Community
- A community includes all of the different populations (of different species) living in the same area at the same time
- A community is a collection of interacting populations within an ecosystem
- For example, each species within a community depends on other species for food, shelter, pollination, seed dispersal, etc.
Habitat
- A habitat is the local environment in which an organism, species, population or community normally lives
- E.g. badgers, deer, oak trees and ants are all species that would live in a woodland habitat
- A description of the habitat of a species can include both geographical and physical locations, as well as the type of ecosystem required to meet all environmental conditions needed for the survival of the organism, species, population or community
Ecosystems
- An ecosystem refers to a community of living organisms, along with their physical environment, interacting as a system within a specific area
- This includes the living, biotic components (such as plants, animals, fungi and microorganisms) interacting with the non-living, abiotic components (such as soil, water, air, sunlight, temperature, humidity and minerals)
- These abiotic components provide the essential resources and conditions necessary for the survival and functioning of the biotic community
- Together, the interactions between biotic and abiotic components shape the structure and dynamics of the ecosystem, influencing factors such as biodiversity, nutrient cycling and ecosystem services
- Ecosystems vary in size, from small ponds to vast forests
- Each ecosystem has its own unique characteristics, shaped by factors like geography, climate and the species present within it
- Ecosystems are open systems in which both energy and matter can enter and exit. For example:
- Photosynthetic organisms such as plants and algae capture sunlight, which is the primary source of energy for ecosystems
- Energy exits ecosystems primarily through heat released during cellular respiration, lost during trophic transfers (e.g. from herbivores to carnivores) and radiated from the Earth’s surface into space
- Matter can enter or exit ecosystems in the form of water, nutrients, gases or waste products produced by animals
📌 Classification and Taxonomic Tools
Classification
- There are millions of different species that currently exist on Earth
- Biologists and ecologists can manage and organise this enormous diversity of species by putting similar species together into groups
- This process is known as classification
- It involved organising and categorising species based on their similarities and differences
- Species are grouped into a hierarchy of different categories according to the biological characteristics that they share
- Classifying species in this way allows us to quickly identify them and predict their characteristics
Taxonomic Tools
- Taxonomists use various tools to identify an organism and to help them decide how to classify it
- Identification in this context means determining which species an individual organism belongs to
Comparison of specimens with reference collections
- Taxonomists can compare unknown specimens with well-documented reference collections
- These reference collections contain a large number of similar organisms that have already been identified and classified
- This method involves physically comparing the specimen to known samples
- It relies on the taxonomist’s expertise and the quality of the reference collection
- For example, a botanist could identify an unknown plant specimen by visually comparing it with a large collection of known plant species at a botanical garden
- Today there are apps that identify unknown species by comparing a photo to thousands of photos of different species in an online database (a virtual reference collection)
DNA surveys
- DNA surveys involve analysing an organism’s DNA to determine its species
- This method compares the DNA sequence of the specimen with known sequences from a very large number of species, stored in very large computer databases
- It provides precise and reliable identification, especially for closely related species
- For example, in a wildlife conservation project, researchers could use DNA surveys to distinguish between similar-looking species of butterflies
Dichotomous keys
- Dichotomous keys are tools used to identify organisms based on their characteristics
- The keys consist of a series of paired statements or questions with two possible answers
- Each pair offers two choices, leading the user to another pair of statements or questions, eventually resulting in the identification of the organism
- Below is an example of a dichotomous key that can be used to identify eight species in the Serengeti ecosystem:
| 1 | a | Animal covered in black and white stripes | Zebra (Equus quagga) |
| b | Animal not covered in black and white stripes | go to 2 | |
| 2 | a | Animal is a large cat | go to 3 |
| b | Animal is not a large cat | go to 4 | |
| 3 | a | Animal covered in spots | Cheetah (Acinonyx jubatus) |
| b | Animal not covered in spots | Lion (Panthera leo) | |
| 4 | a | Animal has horns | go to 5 |
| b | Animal does not have horns | go to 7 | |
| 5 | a | Horns meet in the middle of the head | Cape buffalo (Syncerus caffer) |
| b | Horns do not meet in the centre of the head | go to 6 | |
| 6 | a | Horns are long and curved | Grant’s gazelle (Nanger granti) |
| b | Horns are not long and curved | Oribi (Ourebia ourebi) | |
| 7 | a | Animal has a long neck | Giraffe (Giraffa camelopardalis) |
| b | Animal does not have a long neck | African elephant (Loxodonta africana) |
- There are limitations to using a dichotomous identification key:
- Limited scope:
- Dichotomous keys are typically designed to identify a limited number of species and may not be comprehensive enough to identify all organisms in a given ecosystem
- Inaccuracies:
- Dichotomous keys are only as accurate as the information provided
- If the key is not designed properly or lacks important distinguishing characteristics, the identification may be inaccurate
- Variability:
- Organisms can exhibit variability in their physical characteristics, which can make it difficult to accurately identify them using a dichotomous key
- Time-consuming:
- Using a dichotomous key can be a time-consuming process, especially for beginners who are not familiar with the organisms in question
- Expertise required:
- Dichotomous keys require a certain level of expertise and familiarity with the organisms in question
- Beginners may find it difficult to use the key without assistance from an expert
- Limited to physical characteristics:
- Dichotomous keys are limited to the physical characteristics of organisms and may not take into account other important factors, such as behaviour or habitat, which can be important in identifying certain species
- Limited scope:
🔍 TOK Tip: To what extent can ecological models predict real-world outcomes?
📌 Factors Affecting Populations
Biotic & abiotic factors
- Factors that determine the distribution of a population can be abiotic or biotic
- Biotic refers to the living components of an ecosystem
- Abiotic refers to non-living, physical factors that may influence organisms
Biotic factors
- The living, biological factors that influence ecosystems and the communities of organisms within them are termed biotic factors
- In other words, biotic factors are the interactions between the organisms within a population or community
- Biotic factors include:
- Predation
- Herbivory
- Parasitism
- Mutualism
- Disease
- Competition
Examples of Biotic Factors
| Biotic Factor | How it Affects Communities | Example |
|---|---|---|
| Availability of food | More food means organisms have a higher chance of surviving and reproducing. This means their populations can increase. | Rainforest ecosystems have a rich food supply and this allows many species to live there. Deserts have a poor food supply, which allows fewer species to live there. |
| New predators | In balanced ecosystems, predators catch enough prey to survive but not so many that they wipe out the prey population. If a new predator is introduced to the ecosystem, the system may become unbalanced. | Red foxes were introduced for recreational hunting in Australia in the 1800s but have since caused the decline of many native species that they feed on, such as small mammals and birds. This has also reduced the food supply for native predators. |
| New pathogens | If a new pathogen enters an ecosystem, the populations living there will have no immunity or resistance to it, and the population may decline or be wiped out. | Avian flu can cause population declines in wild bird species. An outbreak of the H5N1 virus in the bar-headed goose in Qinghai Lake, China, in 2005 caused the deaths of over 6 000 birds in the area, representing a significant proportion of the bar-headed goose population. |
| Competition | If two species compete for the same resource(s) and one is better adapted to take advantage of these resources, then that species will outcompete the other. This may continue until there are too few members of the less well-adapted species to breed successfully. | North American grey squirrels were introduced to the UK in the 1800s and have since caused a decline in our native red squirrel population. Grey squirrels have outcompeted red squirrels for resources such as food and nest-sites. They also carry a virus (a new pathogen) that red squirrels have no resistance to. |
Abiotic factors
- The non-living, physical factors that influence ecosystems and the communities of organisms within them are termed abiotic factors
- These include factors such as:
- Temperature
- Sunlight
- pH (soil and water)
- Salinity
- Dissolved oxygen
- Soil texture
- Moisture and precipitation levels
- Minerals and nutrients
- Wind intensity
- Carbon dioxide levels (for plants)
- Changes in abiotic factors can affect the survival and reproduction of organisms, and the overall functioning of ecosystems
- Abiotic factors can be quantified (measured) to help determine the distribution of species in aquatic or terrestrial ecosystems
Examples of Abiotic Factors
| Abiotic Factor | How it Affects Communities |
|---|---|
| Temperature | Affects the rate of photosynthesis in plants. It also affects the rate of metabolism, growth, and reproduction of organisms. Certain species have adapted to specific temperature ranges and cannot survive outside of those ranges. |
| Sunlight | Plants require light for photosynthesis. More light leads to an increase in the rate of photosynthesis and an increase in plant growth rates. |
| pH (soil and water) | pH levels affect the availability of nutrients in soil and water, influencing plant growth and the survival of aquatic organisms. Certain species are adapted to specific pH ranges. |
| Salinity | It affects the health and survival of aquatic organisms, particularly those that are adapted to specific salinity levels. |
| Dissolved oxygen | Essential for the survival of aquatic organisms, particularly fish. Low oxygen levels can lead to hypoxia and negatively impact aquatic ecosystems. |
| Soil texture | Influences water retention, nutrient availability, and root penetration, affecting plant growth and the distribution of soil-dwelling organisms. |
| Moisture and precipitation | Determines the amount of water available to organisms, which can impact their survival, growth, and reproduction. |
| Minerals and nutrients | Different species of plants are adapted to different soil mineral contents and nutrient concentrations, influencing plant growth and community composition. |
| Wind intensity | Wind speed affects the transpiration rate in plants and can disperse seeds and pollen, influencing plant distribution and reproduction. |
| Carbon dioxide levels | CO2 is required for photosynthesis in plants. CO2 concentration affects the rate of photosynthesis and overall plant growth. |
Ecological niches
- A niche describes the particular set of abiotic and biotic conditions and resources to which an organism or population responds and upon which an organism or population depends
- Each individual species has its own distinct niche because only one species can occupy a given niche.
- If two species try to occupy the same niche, they will compete with each other for the same resources
- One of the species will be more successful and out-compete the other species until only one species is left and the other is either forced to occupy a new, slightly different niche or to go extinct from the habitat or ecosystem altogether
- For example, the three North American warbler species shown below all occupy the same habitat(spruces and other conifer trees) but occupy slightlydifferent niches as each species feeds at a different height within the trees
- This avoids competition between the three species, allowing them to co-exist closely with each other in the same habitat
Population interactions
- A population is a group of organisms of the same species living in the same area at the same time
- Populations are characterised through:
- Size
- Density
- Distribution
- Age structure
- Growth rate
- Interaction with each other
- Ecosystems consist of many populations of numerous different species interacting with each other
- Populations interact in ecosystems through:
- Herbivory
- Predation
- Parasitism
- Mutualism
- Disease
- Competition
- Resulting in ecological, behavioural and evolutionary consequences
Herbivory
- When an organism (known as an herbivore) feeds on a plant
- The carrying capacity of herbivore species is affected by the number of plants they feed on
- An area with more plant resources will have a higher carrying capacity for herbivore species
- This can have negative feedback effects (i.e. the carrying capacity of the herbivore species may decrease if herbivory rates are too high and the plant population decreases too much)
Predation
- When one animal eats (preys upon) another
- This lowers the carrying capacity of the prey species
- This can also have negative feedback effects, lowering the carrying capacity of the predator species due to a decrease in prey numbers
- In a stable community, the numbers of predators and prey rise and fall in cycles, limiting the carrying capacity of both predator and prey populations.
Mutualism
- A mutualistic relationship between species is one in which both species benefit
- This increases the carrying capacity of both species in the relationship
- An example of a mutualistic relationship is the one that exists between bees and many species of flowering plants
- Bees gain nectar (i.e. food to provide them with energy) from flowers
- When bees visit flowers, pollen is transferred to their bodies
- As bees visit multiple different flowers, they spread the pollen to these flowers, pollinating them
- In this way, the flowers gain help in reproducing
Disease
- Pathogens (bacteria, viruses, fungi, and protozoa) are organisms that cause diseases
- These diseases lower the carrying capacity of the species that the pathogens infect
- Changes in the incidence of diseases can cause populations to fluctuate around their carrying capacity
Competition
- Competition can be divided into intraspecific competition (competition between members of the same species) and interspecific competition (competition between members of different species)
- Intraspecific competition can lower the carrying capacity of a population due to a decrease in food availability caused by high population density
- Interspecific competition occurs between species with similar niches, causing a decrease in the carrying capacity of one or both species
📌 Population Growth
Carrying capacity
- The maximum stable population size of a species that an ecosystem can support (determined by competition for limited resources) is known as the carrying capacity
- Every individual within a species population has the potential to reproduce and have offspring that will contribute to population growth
- In reality, however, there are many abiotic and biotic factors that prevent every individual in a population from making it to adulthood and reproducing
- This ensures the population size of each species is limited at some point (i.e. the carrying capacity of that species is reached)
- This is why no single species has a population size that dominates all other species populations on Earth, with the exception of humans (as we have managed to overcome many of the abiotic and biotic factors that could potentially limit the population growth of our species)
Density-dependent factors & negative feedback mechanisms
- Population size is regulated by density-dependent factors and negative feedback mechanisms
- Density-independent factors may influence population size
- For example, environmental conditions like climate, temperature, rainfall patterns and soil fertility can limit the size of a population
- However, it is mainly density-dependentfactors that regulate populations around the carrying capacity
- Density-dependent factors are factors whose impact on population size varies with the population’s density
Density-dependent factors
- Competition for resources:
- As population density increases, individuals compete more intensely for limited resources like food, water and shelter
- For example, in a forest ecosystem, as deer population density rises, competition for available food (grass, leaves, etc.) increases, placing limits on individual growth rates and overall population size
- As population density increases, individuals compete more intensely for limited resources like food, water and shelter
- Increased risk of predation:
- Higher population density increases the likelihood of predators encountering prey, leading to more predation events
- For example, in a coral reef ecosystem, as fish populations grow denser, predation by larger fish species also increases, regulating the population size of smaller fish species
- Higher population density increases the likelihood of predators encountering prey, leading to more predation events
- Pathogen transmission:
- Dense populations facilitate the spread of pathogens, such as diseases and parasites, leading to increased mortality rates
- For example, in a population of bats living in a cave, as population density increases, close contact between individuals facilitates the transmission of pathogens—this increased pathogen transmission can lead to higher mortality rates among bats, regulating the population size
- Dense populations facilitate the spread of pathogens, such as diseases and parasites, leading to increased mortality rates
Negative feedback mechanisms
- Density-dependent factors drive negative feedback mechanisms, which act to return a population to its equilibrium state, maintaining stability
- As population density rises, factors like resource scarcity, increased predation and disease outbreaks trigger mechanisms that reduce population growth rates
Population growth curves
- Population growth can either be exponential or limited by carrying capacity
- If there are no limiting factors, population growth follows a J-curve (exponential growth)
- When density-dependent limiting factors start to operate, the curve becomes S-shaped
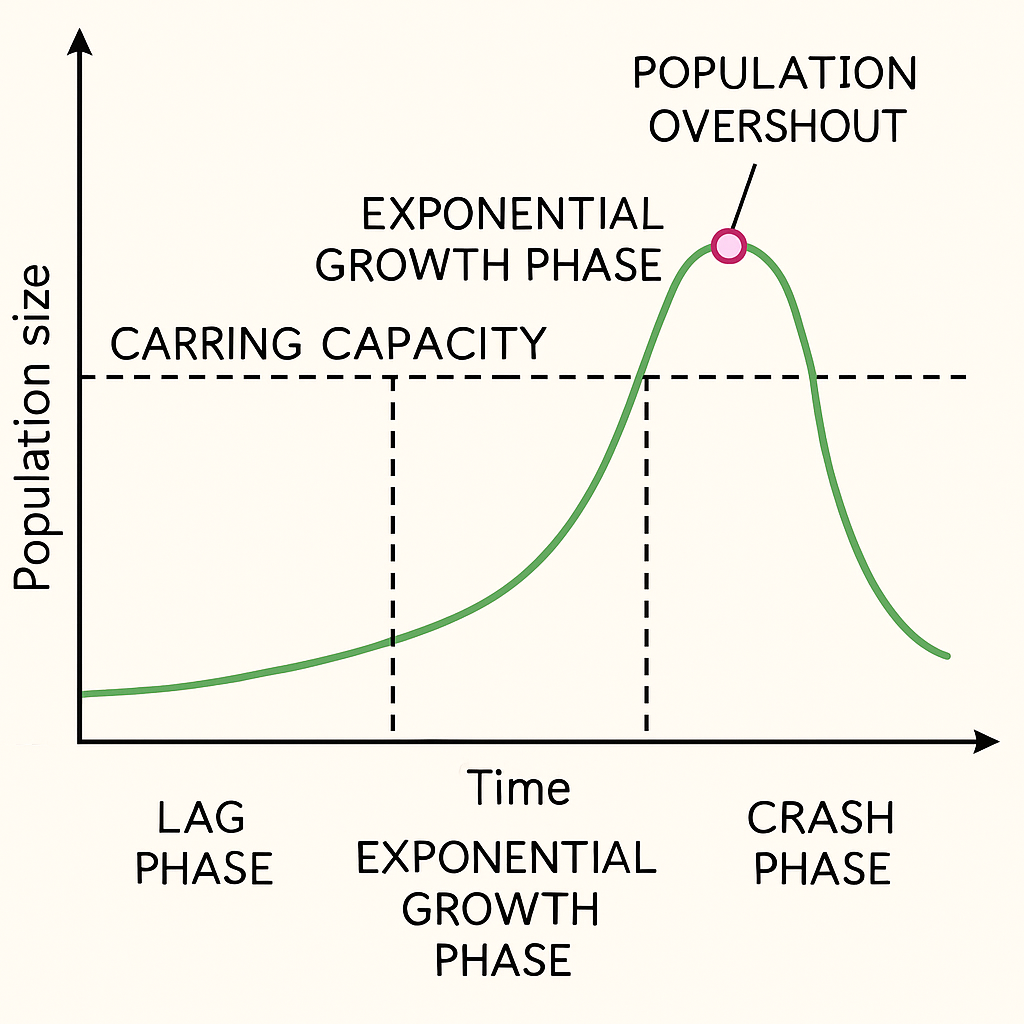
J-curves
- For some populations, when population growth is plotted against time, a J-curve is produced
- A J-curve describes the growth pattern of a population in an environment with unlimited resources
- The J-curve has three distinct phases:
- Lag phase:
- The initial growth is slow when the population is small
- Exponential growth phase:
- Population growth accelerates exponentially as the number of individuals increases
- The curve takes a J-shape due to exponential growth, as resources are not limiting the growth of the population
- The population will continue to grow until a limiting factor such as disease or predation occurs
- Crash phase:
- At this point, if there has been a significant population overshoot (if the population has increased far beyond the natural carrying capacity), there may be a sudden decrease in the population, known as a population crash
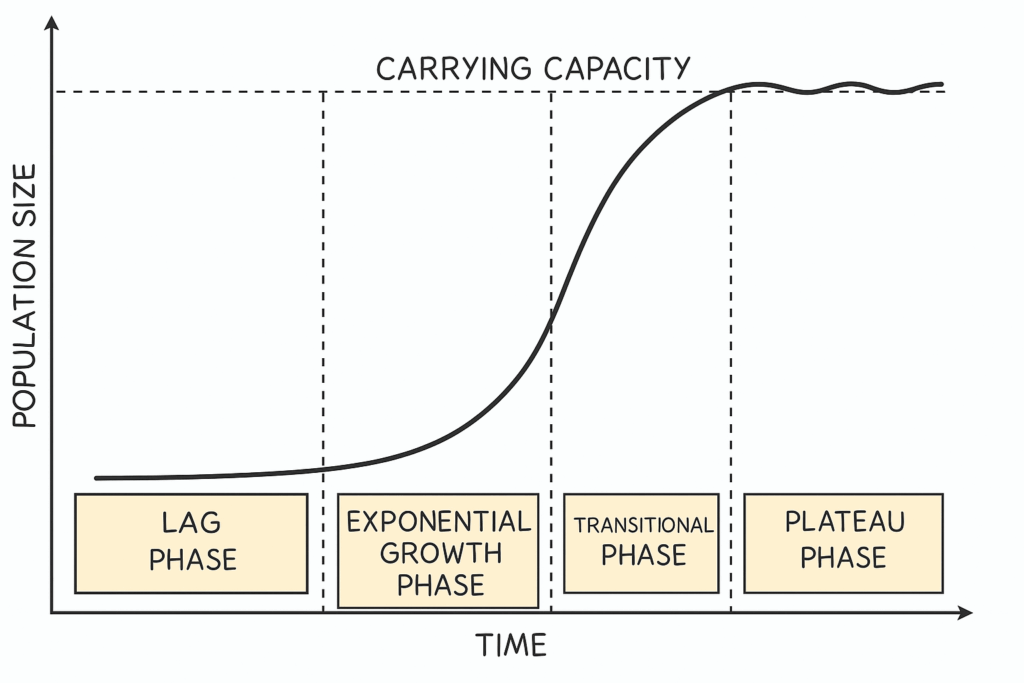
S-curves
- For most populations, when population growth is plotted against time, an S-population curve is produced
- An S-population curve describes the growth pattern of a population in a resource-limited environment
- The S-population curve has four distinct phases:
- Lag phase:
- The initial growth is slow when the population is small
- Exponential growth phase:
- With low or reduced limiting factors, the population expands exponentially into the habitat
- Transitional phase:
- As the population grows, there is increased competition between individuals for the same limiting factors or resources
- This competition results in a lower rate of population increase
- Plateau phase:
- The population reaches its carrying capacity and fluctuates around a set point determined by the limiting factors
- Changes in limiting factors cause the population size to increase and decrease (these increases and decreases around the carrying capacity are controlled by negative feedback mechanisms)
📌 Human Populations
Limiting factors on human population growth
- Human societies are increasingly able to overcome the limiting factors that once slowed down the growth of human populations
- As well as allowing human population to dramatically increase in size in over the last few hundred years, this also has many negative consequences for the sustainability of ecosystems
- The main reasons humans have been able to eliminate these limiting factors include:
- Elimination of natural predators:
- Removal of natural predators like wolves or big cats has led to unchecked growth in certain human populations
- This has also resulted in imbalances in ecosystems, such as overgrazing by deer populations due to the absence of wolves
- For example, in Yellowstone National Park, reintroduction of wolves helped control the elk population, which in turn allowed vegetation to regenerate and stabilised the ecosystem
- Technological advances:
- Technological advancements in agriculture and medicine have reduced mortality rates and increased food production
- This has led to exponential population growth as more people survive and reproduce
- The Green Revolution in the mid-20th century, with the introduction of high-yield crop varieties and modern agricultural techniques, significantly increased food production globally
- Degradation of the environment:
- Our degradation of the environment has allowed humans to extract valuable resources like timber, minerals and fossil fuels
- Clearing of forests for agriculture and urbanisation provides more living space and land for food production, increasing human population growth rates
- Environmental degradation continues to facilitate the extraction of energy sources, such as fossil fuels, which are vital for sustaining growing populations
- However, these activities also disrupt ecosystems, leading to habitat destruction, pollution and resource depletion
- Negative impacts on biodiversity and ecosystem services compromise the sustainability of ecosystems and eventually their ability to support human populations
Assessing carrying capacity for human populations
- Scientists use various methods to estimate the carrying capacity of an environment for a given species
- These methods include field observations, population surveys, mathematical modelling and data analysis
- By studying population trends, resource availability and species interactions, researchers can make informed estimates of carrying capacity
- However, estimating carrying capacity becomes challenging when it comes to human populationsdue to several reasons:
The broad and changing ecological niche of humans
- Populations in ecosystems tend to reach equilibrium when the availability of resources matches the population’s needs
- However, humans have a broad and dynamic ecological niche, constantly adapting through technological innovations and changes in consumption patterns
- Mobility of resources:
- Humans have the ability to move and exploit resources beyond their immediate habitat
- This mobility complicates the assessment of carrying capacity, as humans can draw resources from distant locations
- For example, global trade allows societies to access resources like food and materials from around the world, solving the problem of local resource limitations
- Technological advancements:
- Human societies have the ability to modify their environment and overcome traditional carrying capacity limitations through technology
- For example, the development of agriculture and irrigation techniques has allowed humans to increase food production and support larger populations beyond what the natural environment could sustain
- Human societies have the ability to modify their environment and overcome traditional carrying capacity limitations through technology
- Cultural and social factors:
- Human population dynamics are influenced by cultural norms, social behaviours and economic factors
- For example, these can affect fertility rates and migration patterns, making it difficult to accurately predict or estimate carrying capacity for human populations
- Human population dynamics are influenced by cultural norms, social behaviours and economic factors
- Changing lifestyles and consumption patterns:
- Human populations are characterised by varying lifestyles and consumption rates, which can significantly impact resource demands and environmental impacts
- For example, urbanised societies with high levels of consumption may strain the carrying capacity of their surrounding areas due to increased resource demands and waste generation
- Human populations are characterised by varying lifestyles and consumption rates, which can significantly impact resource demands and environmental impacts
- Adaptive capacity:
- More so than any other species, humans have the ability to adapt and innovate in response to changing environmental conditions
- This adaptability can affect carrying capacity by influencing resource use efficiency and the development of technological solutions
Disputed estimates of carrying capacity
- Urbanisation and industrialisation continually reshape human habitats, making it challenging to estimate carrying capacity
- Estimates are often disputed due to uncertainties in factors like technology, consumption patterns and environmental degradation
📌 Studying Populations
What is a population?
- A population refers to the whole set of things that you are interested in
- e.g. if a teacher wanted to know how long pupils in year 11 at their school spent revising each week then the population would be all the year 11 pupils at the school
- Population does not necessarily refer to a number of people or animals
- e.g. if an IT expert wanted to investigate the speed of mobile phones then the population would be all the different makes and models of mobile phones in the world
What is a sample?
- A sample refers to a selected part (i.e. a subset) of the population that data is collected from
- e.g. for the teacher investigating year 11 revision times, a sample would be a certain number of pupils from year 11
- A random sample is where every item in the population has an equal chance of being selected
- e.g. every pupil in year 11 would have the same chance of being selected for the teacher’s sample
- A biased sample is where the sample is not random
- e.g. the teacher asks pupils from just one class
What are the advantages and disadvantages of using a population?
- You may see or hear the word census – this is when data is collected from every member of the whole population
- The advantages of using a population include:
- Accurate results – as every member/item of the population is used
- All options/opinions/responses will be included in the results
- The disadvantages of using a population include:
- Time consuming to collect the data
- Expensive due to the large numbers involved
- Large amounts of data to organise and analyse
What are the advantages and disadvantages of using a sample?
- The advantages of using a sample include:
- Quicker to collect the data
- Cheaper as not so much work involved
- Less data to organise and analyse
- The disadvantages of using a sample include:
- A small sample size can lead to unreliable results
- Sampling methods can usually be improved by taking a larger sample size
- A sample can introduce bias
- Particularly if the sample is not random
- A sample might not be representative of the population
- Only a selection of options/opinions/responses might be accounted for
- The members/items used in the sample may all have similar responses
- e.g. even with a random sample, it may be possible that the teacher happens to select pupils for their sample who all happen to do very little revision
- A small sample size can lead to unreliable results
- It is important to recognise that different samples (from the same population) may produce different results
- There are two different types of sampling:
- Random
- Systematic
- In random sampling, the positions of the sampling points are completely random or due to chance
- For example, sampling points can be selected using a random number generator to create a set of random coordinates
- This method is beneficial because it means there will be no bias by the person who is carrying out the sampling that may affect the results (i.e. there will be no researcher bias)
- Random sampling can be used when the population size or the individual sample size is relatively small, and all individuals have an equal chance of being sampled
- In systematic sampling, the positions of the sampling points are chosen by the person carrying out the sampling and a regular pattern is used to select sample points
- There is a possibility that the person choosing could show bias towards or against certain areas
- Individuals may deliberately place the quadrats in areas with the least species as these will be easier and quicker to count
- This is unrepresentative of the whole area
- When a sampling area is reasonably uniform or has no clear pattern to the way the species are distributed, random sampling is the best choice
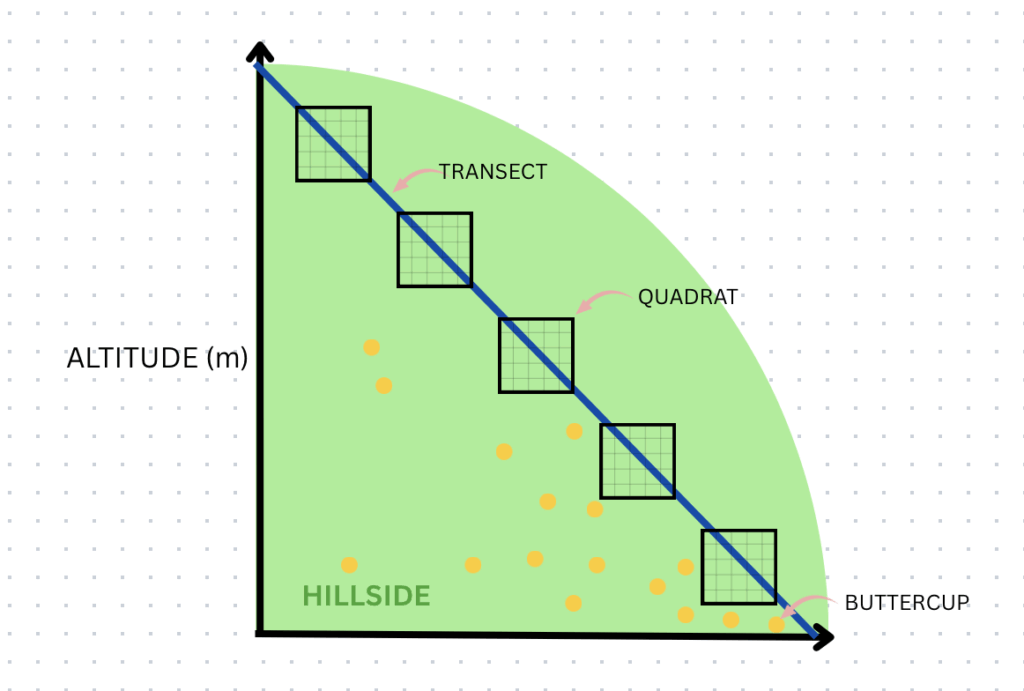
Transect sampling
- Systematic sampling allows researchers to investigate the effect of the presence of certain environmental features on species distribution e.g. by taking samples along a line that extends away from, or along, an environmental feature, such as a river
- A line of this type is known as a transect
- Transect sampling is used when there is a clear change in the physical conditions across the area being studied
- For example, there may be changes in altitude, soil pH or light intensity
- Methods using transects can help show how species distribution changes with the different physical conditions in the area
- A transect is a line represented by a measuring tape, along which samples are taken
- For a line transect:
- Lay out a measuring tape in a straight line across the sample area
- At equal distances along the tape, record the identity of the organisms that touch the line (e.g. every 2 m)
- For a belt transect:
- Place quadrats at regular intervals along the tape and record the abundance or percentage cover of each species within each quadratA line transect and belt transect is carried out in a habitat
Quadrat sampling
- Quadrats are square frames made of wood or wire
- They can be a variety of sizes e.g. 0.25 m2 or 1 m2
- They are placed on the ground and the organisms within them are recorded
- Non-motile organisms such as plant species are commonly studied using random quadrat sampling to estimate their population size
- Quadrats can be used to estimate population size by recording:
- The number of an individual species: the total number of individuals of a single species (e.g. daisies) is recorded
- Percentage cover: the approximate percentage of the quadrat area in which an individual species is found is recorded (this method is often used when it is difficult to count individuals of the plant species being recorded eg. grass or moss)
Estimating percentage cover and percentage frequency
- Percentage cover is an estimate of the area within a given quadrat covered by the plant or animal being sampled
- Percentage frequency is the number of squares in which the species occurs divided by the number of possible occurrences
% frequency = (number of quadrat squares in which species present ÷ total number of quadrat squares) × 100
- This can be useful, as it can sometimes be difficult to count individual plants or organisms within a quadrat
- For example, if grass is found in 89 out of 100 squares in the quadrat then it has a percentage frequency of 89%
- This process could be repeated for a series of quadrats within a given sample area
- This information could then be used to calculate the average percentage cover across all the sampled quadrats
Capture–mark–release–recapture & the Lincoln index
- The sampling methods described above are only useful for non-motile (sessile) organisms
- Different methods are required for estimating the number of individuals in a population of motile animals (i.e. animals that are mobile)
- The capture-mark-release-recapture method is commonly used alongside the Lincoln index (a statistical measure used to estimate population size)
- The Lincoln index can be used to estimate the abundance or population size of a species in a given area
- First, the capture-mark-release-recapture technique is carried out
- For a single species in the area:
- The first large sample is taken—as many individuals as possible are caught, counted and markedin a way that won’t affect their survival e.g. if studying a species of beetle, a small amount of brightly coloured non-toxic paint can be applied to their carapace (shell)
- The marked individuals are returned to their habitat and allowed to randomly mix with the rest of the population
- When a sufficient amount of time has passed another large sample is captured
- The number of marked and unmarked individuals within the sample are counted
- The proportion of marked to unmarked individuals is used to calculate an estimate of the population size (the Lincoln index)
- The formula for calculating the Lincoln index is:
Population size estimate = (M × N) ÷ R
- Where:
- M = number of individuals caught in the first sample (i.e. number of marked individuals released)
- N = number of marked and unmarked individuals caught in the second sample (i.e. total number of individuals recaptured)
- R = number of marked individuals in the second sample (i.e. number of marked individuals recaptured)
Limitations of using the capture-mark-release-recapture method
- When using the mark-release-capture method, there are a few assumptions that have to be made:
- The marked individuals must be given sufficient time to disperse and mix back in fully with the main population – this can be time-consuming
- The marking doesn’t affect the survival rates of the marked individuals (e.g. doesn’t make them more visible and therefore more likely to be predated)
- The marking remains visible throughout the sampling and doesn’t rub off – this is often difficult to ensure and so the accuracy of population size estimates may be negatively affected
- The population stays the same size during the study period (i.e. there are no significant changes in population size due to births and deaths and there are no migrations into or out of the main population) – again, this is almost impossible to ensure, further affecting the accuracy of population size estimates
📌 Ecosystem Functioning and Sustainability
Sustainability of ecosystems
- Sustainability is a fundamental property of ecosystems
- It refers to the ecosystem’s ability to maintain balance and productivity over time
- Ecosystems naturally regulate themselves to sustain life within them
Balanced inputs and outputs
- In a steady-state ecosystem, inputs and outputs are balanced
- Inputs include energy, nutrients and water entering the ecosystem
- Outputs include energy, nutrients and waste leaving the ecosystem
- This balance ensures the ecosystem’s long-term stability and resilience
- These inputs and outputs can be illustrated with ecosystem flow diagrams
- Flow diagrams demonstrate the movement of energy and nutrients within ecosystems
- These diagrams highlight the interconnectedness of biotic and abiotic factors within an ecosystem
Evidence of long-term sustainability
- Some ecosystems have persisted for millions of years, indicating their long-term resilience and sustainability
- Tropical rainforests are a prime example of long-term sustainable ecosystems
- Despite changes in climate and other external factors, these ecosystems have endured
- For example, the Amazon Rainforest has remained stable despite external pressures like deforestation
- Its great biodiversity and complex interactions contribute to its resilience
Human impacts on ecosystem stability
- Human activity can disrupt the stability of ecosystems, leading to tipping points
- Tipping points are critical thresholds where small changes can trigger significant shifts in the ecosystem
- These shifts can lead to the collapse of the original ecosystem and the establishment of a new equilibrium
❤️ CAS Tip: Volunteer with a conservation NGO or wildlife group monitoring local biodiversity.
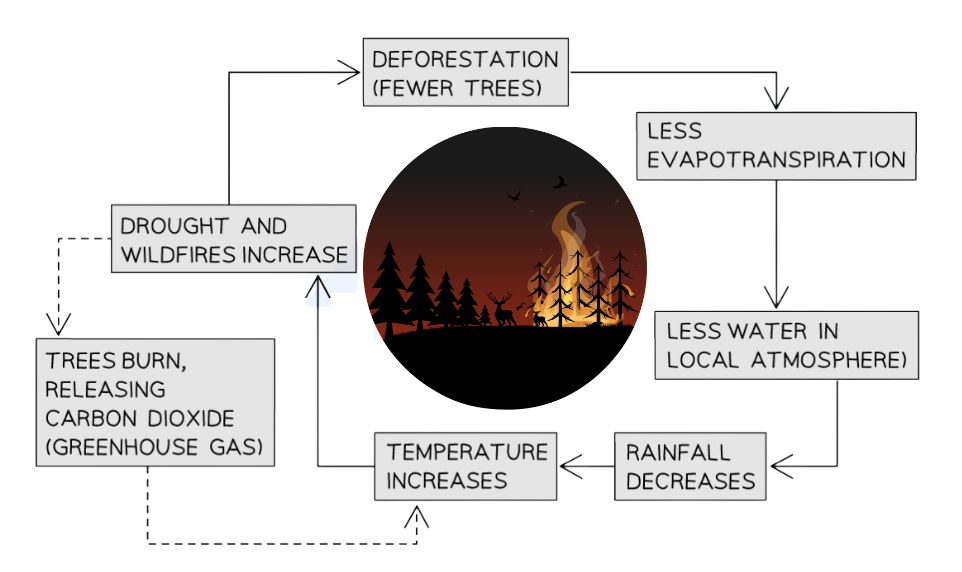
Deforestation in the Amazon Rainforest
- Deforestation involves the clearing of trees for agriculture, logging, or urban development
- Deforestation reduces the generation of water vapour by plants through transpiration
- Impact on climate:
- Reduced transpiration leads to a decrease in the amount of water vapour in the local atmosphere
- Water vapour is essential for cloud formation and precipitation (which generates a significantcooling effect) and for maintaining regional climate patterns
- Consequently, deforestation disrupts local and regional climate systems
- Feedback loop:
- Deforestation can create a positive feedback loop where reduced precipitation leads to further forest loss
- With less precipitation, the remaining forest may become more susceptible to drought and wildfires, accelerating deforestation and, as a result, generating even less transpiration and water vapour for precipitation
- Deforestation can create a positive feedback loop where reduced precipitation leads to further forest loss
- New equilibrium:
- If deforestation continues at its current rate, it may not be long until the Amazon Rainforest reaches a new equilibrium state
- This new equilibrium may feature different compositions of species, reduced biodiversity and very different climate patterns
Understanding the role of keystone species
- Keystone species are organisms within an ecosystem that have a disproportionately large impact on the structure and function of the ecosystem relative to their abundance
- In other words, even if they have a relatively low abundance, keystone species play critical roles in maintaining the health and long-term stability of ecosystems
- Image source: savemyexams.comThe presence of keystone species can help regulate the population sizes of other species and maintain higher levels of biodiversity
- The removal of keystone species can have cascading effects throughout the ecosystem, leading to significant changes in community structure and function
- If their removal disrupts the ecological balance too much, this can increase the risk of ecosystem collapse
Examples of keystone species
- Purple sea stars (Pisaster ochraceus) play a crucial role in controlling mussel populations along the rocky shores of the North Pacific coast
- Sea stars prey on mussels, preventing them from overwhelming the ecosystem
- Without sea stars, mussel populations would expand rapidly and start to dominate the ecosystem, outcompeting other species for space and resources
- This would displace other intertidal organisms, leading to a decline in overall species diversity
- African elephants (Loxodonta africana) play a vital role in shaping the structure and composition of savannah grasslands
- Elephants feed on shrubs and trees, preventing them from becoming too dense and dominating the landscape
- Their browsing behaviour creates gaps in the vegetation, promoting the growth of grasses and increasing habitat diversity—this provides habitats for a greater variety of species, increasing species diversity
- Their movement and feeding activities also contributes to soil nutrient cycling by redistributing nutrients and increasing soil fertility and plant growth
Human impacts on biosphere integrity
- The planetary boundaries model identifies nine key Earth system processes essential for maintaining a stable planet
- These boundaries represent safe operating limits for human activity to prevent irreversible environmental changes
- Changes beyond these boundaries can lead to detrimental effects on Earth’s systems and human well-being
- Biosphere integrity (one of the nine critical processes) refers to the overall health and diversity of life on Earth
- Human activity has significantly impacted biosphere integrity, pushing it beyond critical thresholds
- Disturbances to ecosystems have led to severe loss of biodiversity, disrupting ecological balance and resilience
- Ecosystems and species diversity are highly interlinked, with each depending on the other:
- Healthy ecosystems support diverse species populations, while diverse communities contribute to ecosystem resilience and stability
- Loss of biodiversity due to human activities undermines the integrity of ecosystems, making them more vulnerable to collapse
Evidence from extinction rates
- Extinction rates provide tangible evidence that the planetary boundary for biosphere integrity has been crossed
- Highly accelerated rates of species extinction in recent times indicate severe disturbances to ecosystems and loss of biodiversity
- Human-induced factors such as habitat destruction, pollution and climate change have driven extinction rates to unprecedented levels
Avoiding critical tipping points
- Reversing the loss or “erosion” of biosphere integrity is crucial to preventing catastrophic shifts in Earth’s ecosystems
- Addressing ecosystem damage and species loss is essential to avoiding reaching these critical tipping points
- Ecosystem conservation efforts aim to preserve the structure, function and diversity of ecosystems
- By protecting ecosystems, we can slow the rate of ecosystem damage and reduce the risk of irreversible changes
- Preserving species is a key factor in maintaining ecosystem integrity
- Each species occupies a unique ecological niche within an ecosystem, contributing to its stability and resilience
- Protecting ecosystems helps to preserve the niche requirements essential for the ongoing survival of individual species
- Various conservation strategies can help to protect ecosystems and preserve species diversity, including:
- Habitat conservation: protecting natural habitats from destruction and fragmentation helps maintain ecosystem integrity
- Species conservation: using specific methods to protect the most endangered species is essential for biodiversity conservation
- Sustainable resource management: promoting sustainable practices ensures the responsible use of natural resources without degrading ecosystems