6.2 CLIMATE CHANGE: CAUSES AND IMPACTS
📌 Definitions Table
| Term | Definition (Exam-Ready, 2 Marks) |
|---|---|
| Industrial Revolution | A period of rapid industrial growth beginning in the 18th century, marked by increased fossil fuel use and greenhouse gas emissions. |
| Proxy Data | Indirect evidence (e.g., ice cores, tree rings) used to reconstruct past climate conditions in the absence of direct measurements. |
| Albedo | The proportion of incoming solar radiation reflected by a surface; high albedo surfaces (like ice) reflect more sunlight. |
| Little Ice Age | A period of cooler global temperatures from roughly the 14th to 19th centuries, with regional climate impacts. |
| Planetary Boundaries Model | A framework identifying limits within which humanity can safely operate to avoid destabilizing Earth system processes. |
| Vector-Borne Diseases | Diseases transmitted by vectors such as mosquitoes or ticks, often influenced by climate and environmental changes. |
- 🧠 Exam Tips:
Use dates and impacts when defining historical periods like the Industrial Revolution or Little Ice Age.
Connect albedo and planetary boundaries to climate regulation and system stability for stronger answers.
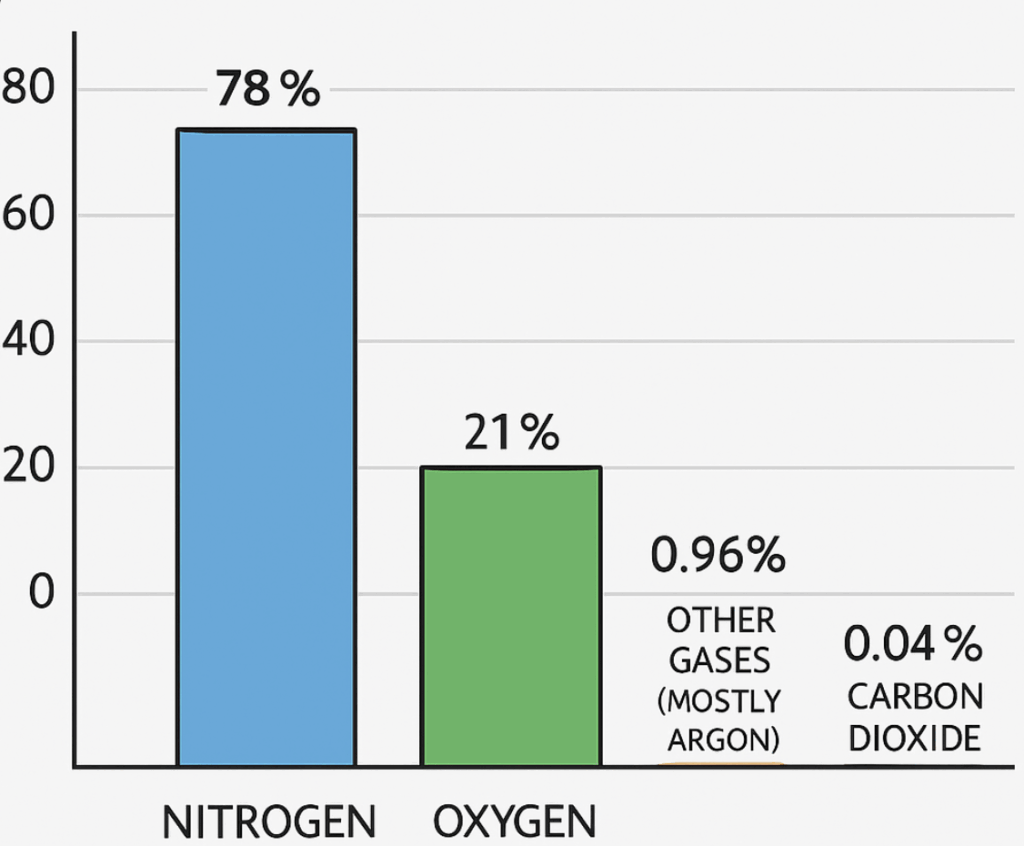
📌 Atmospheric Processes Affecting Climate
- Climate describes the typical conditions resulting from various physical processes in the atmosphere
Atmospheric Processes Affecting Climate
| Process | Explanation |
|---|---|
| Solar radiation | Energy from sun reaches Earth’s surface, varying in intensity due to Earth’s tilt and rotationHeats equator more intensely than poles, creating temperature gradientsInitiates atmospheric processes such as atmospheric circulation and convection currents |
| Atmospheric circulation | Movement of air driven by solar heating and Earth’s rotation, creating global wind patterns (Hadley, Ferrel and Polar cells), which transport heat and moisture |
| Convection currents | Vertical movement of air due to temperature differences, creating weather phenomena (e.g. thunderstorms and tropical cyclones) |
| Condensation and cloud formation | Atmospheric water vapour cools and condenses into liquid droplets or ice crystalsForms clouds that affect weather by reflecting sunlight and trapping infrared radiation |
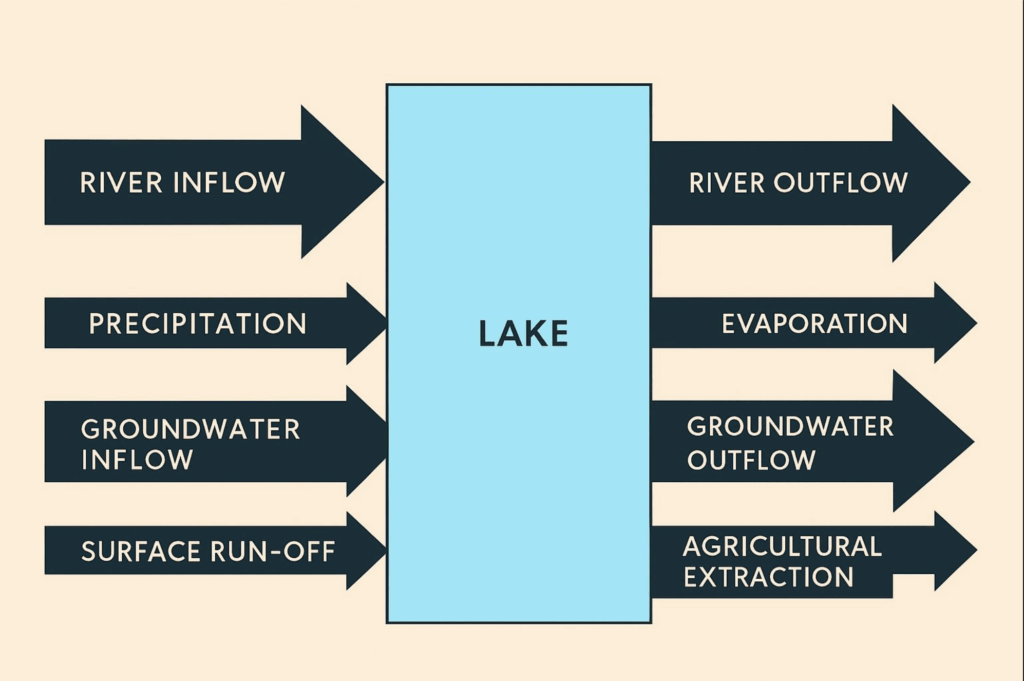
| Precipitation | Water droplets or ice crystals fall from clouds as rain, snow, sleet, or hail, depending on temperature and atmospheric conditions |
| Evaporation | Conversion of water from liquid to vapour phase due to heat, which then rises into the atmosphere |
| Greenhouse effect | Natural process where atmospheric gases in trap heat from sun, making Earth’s temperature suitable for lifeAnthropogenic activities increase concentration of greenhouse gasesEnhances greenhouse effect, increases average annual temperatures and impacts many of the atmospheric processes outlined above |
- The main factors influencing climate are seasonal variations in temperature and precipitation
- These variations shape the long-term climate patterns of a region
📌 Causes of Climate Change
🌐 EE Tip: Analyze historical climate data (e.g., temperature or CO₂ trends) and assess the local impacts or responses.
Anthropogenic influence on climate
- Human activities have significantly increased atmospheric concentrations of greenhouse gasessince the Industrial Revolution
- Particularly carbon dioxide emissions from burning fossil fuels
- This has led to:
- Global warming: average global temperatures have risen due to enhanced greenhouse effect
- Climate change: altered weather patterns, sea level rise and impacts on ecosystems and human societies
Global rate of emissions
- Since 1950, the rate of anthropogenic carbon dioxide emissions has significantly accelerated
- This acceleration is due to several factors, including:
- Industrial Revolution:
- It began in the late 18th century in Europe
- Marked a turning point with the widespread use of fossil fuels such as coal and later oil
- Technological advancements:
- The 20th century saw rapid industrialisation, transportation development and urbanisation
- These all contributed to increased emissions
- Population growth:
- The global population has increased exponentially
- This has increased demand for energy and resources, further accelerating emissions
Analysis of ice cores, tree rings and sediments
- Ice cores, tree rings and sediment deposits provide important data for understanding:
- Historical climate patterns
- The relationship between carbon dioxide levels and global temperatures
- Ice cores:
- Layers of ice in glaciers trap air bubbles containing the gases from ancient atmospheres
- Analysis of these bubbles shows historical carbon dioxide levels
- Ice is deposited as water freezes over time, so the deeper into the ice you go, the older it is
- Tree rings:
- Trees form annual rings with varying widths based on climate conditions
- Thicker rings indicate favourable (warmer) conditions, potentially linked to higher carbon dioxide levels
- Analysis of the width of tree rings can provide a measure of climate during each year of growth
- Taking cores from the trunks of older trees can provide samples that go back over hundreds of years
- Trees form annual rings with varying widths based on climate conditions

Image source: savemyexams.com
- Sediments:
- Deposits in lakes and oceans contain remains of organisms sensitive to environmental changes
- This provides indirect evidence of past climates
- Deposits in lakes and oceans contain remains of organisms sensitive to environmental changes
Positive correlation between carbon dioxide and global temperatures
- Research using data from these sources shows a clear positive correlation between atmospheric carbon dioxide concentrations and global temperatures
- Carbon dioxide levels: as industrial activities have increased, so have atmospheric carbon dioxide levels
- Temperature records: proxy data from ice cores, tree rings and other sources indicates that periods with higher carbon dioxide concentrations correspond to warmer global temperatures
- Modern instrumental records: direct measurements since the mid-20th century confirm a sharp rise in temperatures, aligning with increased emissions
- Since the Industrial Revolution, atmospheric carbon dioxide levels have risen to their highest in Earth’s history
- Before, the highest atmospheric carbon dioxide concentration was around 300 parts per million (ppm)
- It is currently above 400 ppm
- Data show a correlation between changing atmospheric carbon dioxide levels and temperature over thousands of years
- Correlation does not equal causation
- However, this is convincing evidence supporting the hypothesis that carbon dioxide emissions from human activity are driving up global temperatures
Average global temperatures
- Thermometers can be used to measure air temperature
- Records from the mid-1800s show an overall trend of increasing average global temperatures
- There are some short time periods within this window during which temperatures have declined, but the overall trend is upward
- The time period since the mid-1800s corresponds with the time during which humans have been burning fossil fuels
- 90% of global carbon dioxide emissions come from industry and burning fossil fuels
- As carbon dioxide, methane and water vapour are released, they act as greenhouse gases andtrap heat within the Earth’s atmosphere
- Human activities are responsible for almost all of the increase in greenhouse gases in the atmosphere over the last 150 years
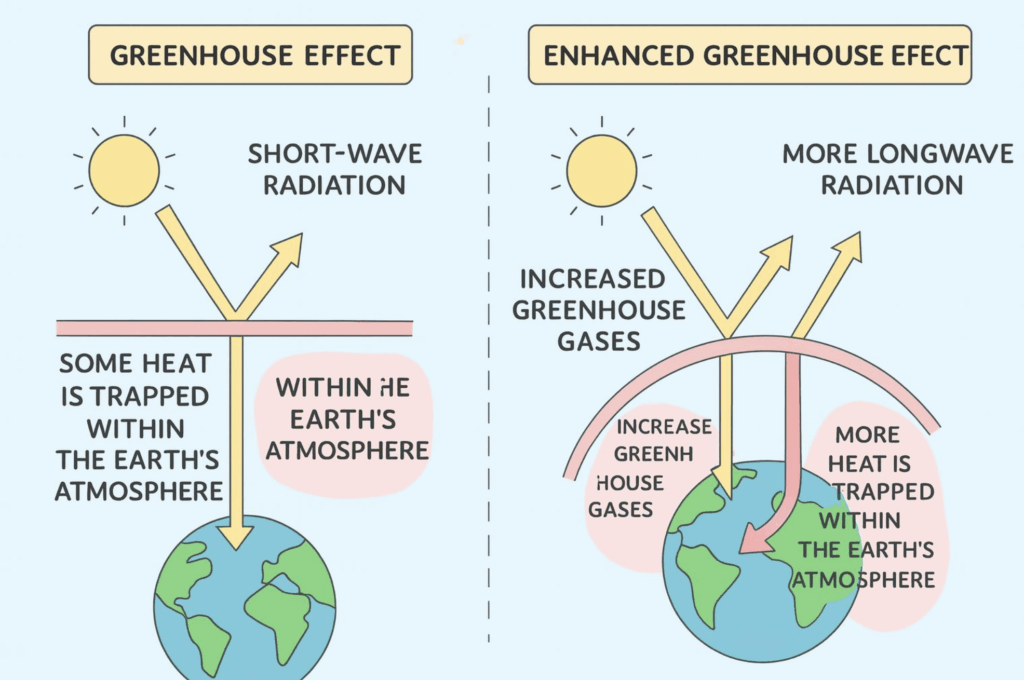
The enhanced greenhouse effect
- The enhanced greenhouse effect is different from the natural greenhouse effect
- It is the result of human activities that release excessive greenhouse gases into the atmosphere
- This leads to an intensified trapping of heat and results in global warming
- The natural greenhouse effect is a necessary process
- It helps regulate the Earth’s temperature by trapping some heat to maintain a habitable climate
- The enhanced greenhouse effect disrupts this balance as a result of greenhouse gas concentrations being artificially increased beyond natural levels
Modelling climate change
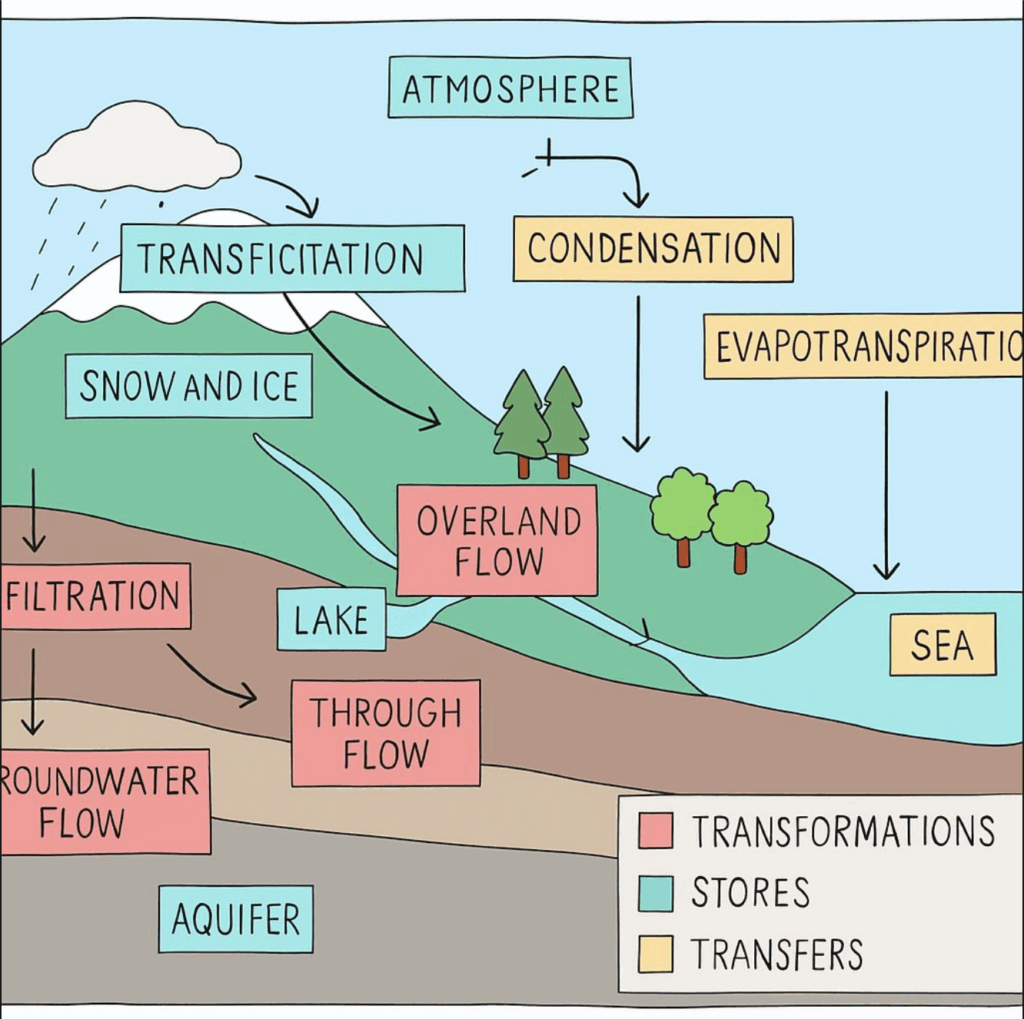
Systems diagrams and models
- Representing cause and effect:
- Systems diagrams and models are tools that can be used to visualise how different factors interact and cause climate change
- They help us understand cause-and-effect relationships and how changes in one part of the system affect others
Feedback loops
- Feedback loops are processes that can either amplify or dampen the effects of climate change
- Positive feedback loops amplify changes
- Negative feedback loops reduce or counteract changes
- Global energy balance:
- The global energy balance is the balance between the energy Earth receives from the Sun and the energy it radiates back into space
- Changes in this balance can significantly impact the climate
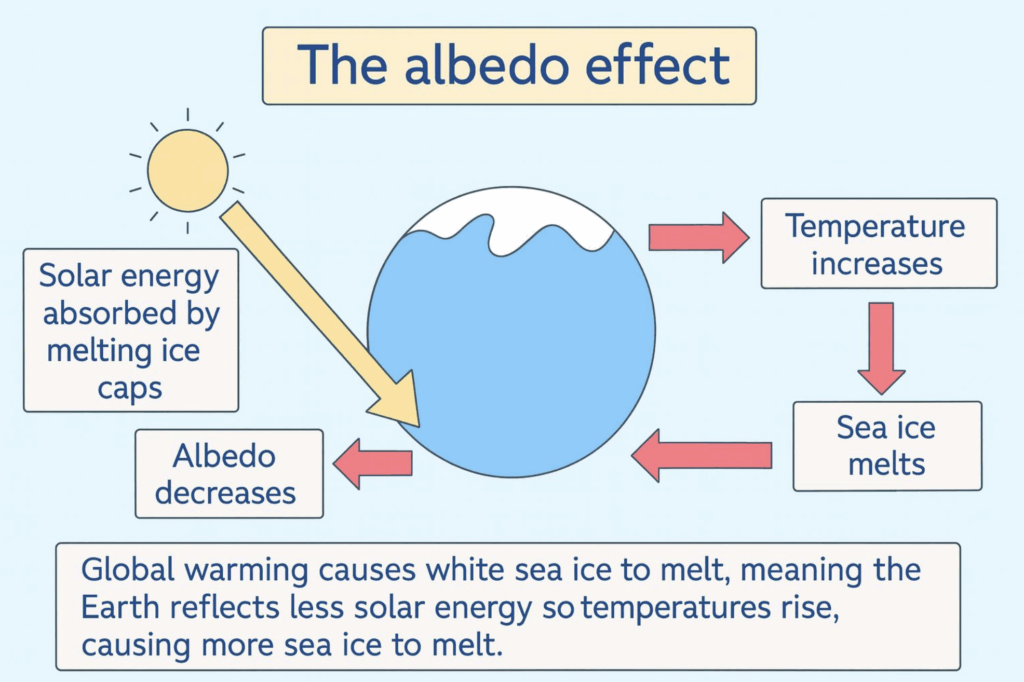
Changes in solar radiation and terrestrial albedo
- Solar radiation is the primary source of energy for Earth’s climate system
- Variations in solar radiation can lead to changes in climate
- For example, the Maunder Minimum (1645–1715), a period with very few sunspots, was associated with cooler global temperatures
- Changes in solar radiation can initiate feedback loops
- Decrease in solar radiation: can cause cooling, leading to an increase in snow and ice cover
- This increases the Earth’s albedo, causing further cooling (negative feedback loop)
- For example, during the Maunder Minimum, reduced solar radiation contributed to the Little Ice Age
- Increase in solar radiation: can cause warming, reducing snow and ice cover
- This decreases the Earth’s albedo, causing further warming (positive feedback loop)
- Decrease in solar radiation: can cause cooling, leading to an increase in snow and ice cover
Carbon dioxide and methane release
- Carbon dioxide and methane are greenhouse gases
- Carbon dioxide and methane get trapped in permafrost as organic matter freezes before it can fully decompose
- Positive feedback loop:
- When the permafrost thaws due to warming temperatures, these trapped gases are released into the atmosphere
- These greenhouse gases then contribute to further global warming and climate change
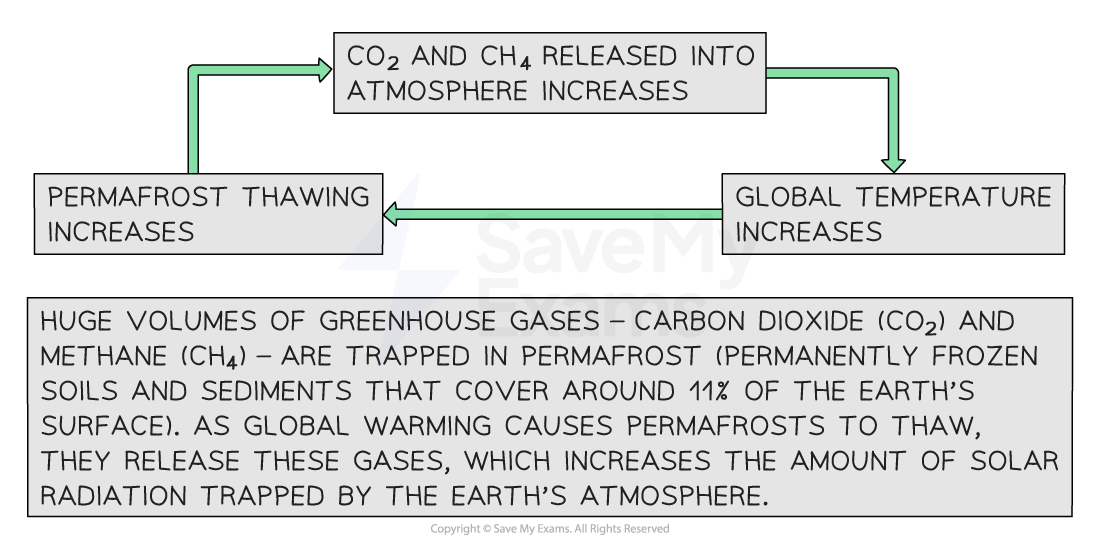
Image source: savemyexams.com
Crossing the planetary boundary for climate change
- Climate change is one of the nine planetary boundaries outlined by the planetary boundaries model
- Planetary boundaries are thresholds that lead to significant environmental changes if they are crossed
- Evidence suggests Earth has alreadycrossed the boundary for climate change
- The Intergovernmental Panel on Climate Change (IPCC) is a leading authority on climate science
- IPCC reports provide comprehensive assessments of climate change, based on the latestscientific research
- These reports show:
- Significant increases in global temperatures:
- Over the past century, the average global temperature has risen by approximately 1.1 °C
- The most rapid warming has occurred in recent decades
- Rising greenhouse gas concentrations:
- Levels of carbon dioxide and methane in the atmosphere have increased dramatically
- Due to human activities like burning fossil fuels, deforestation and agriculture,
- Current impacts:
- These changes contribute to more frequent and intense extreme weather events, such as heatwaves, storms and flooding
- As well as long-term effects like rising sea levels and shifting ecosystems
- Significant increases in global temperatures:
📌 Impacts of Climate Change on Ecosystems
- Climate change:
- Impacts ecosystems on various scales, from local to global
- Affects the resilience of ecosystems
- Leads to biome shifts
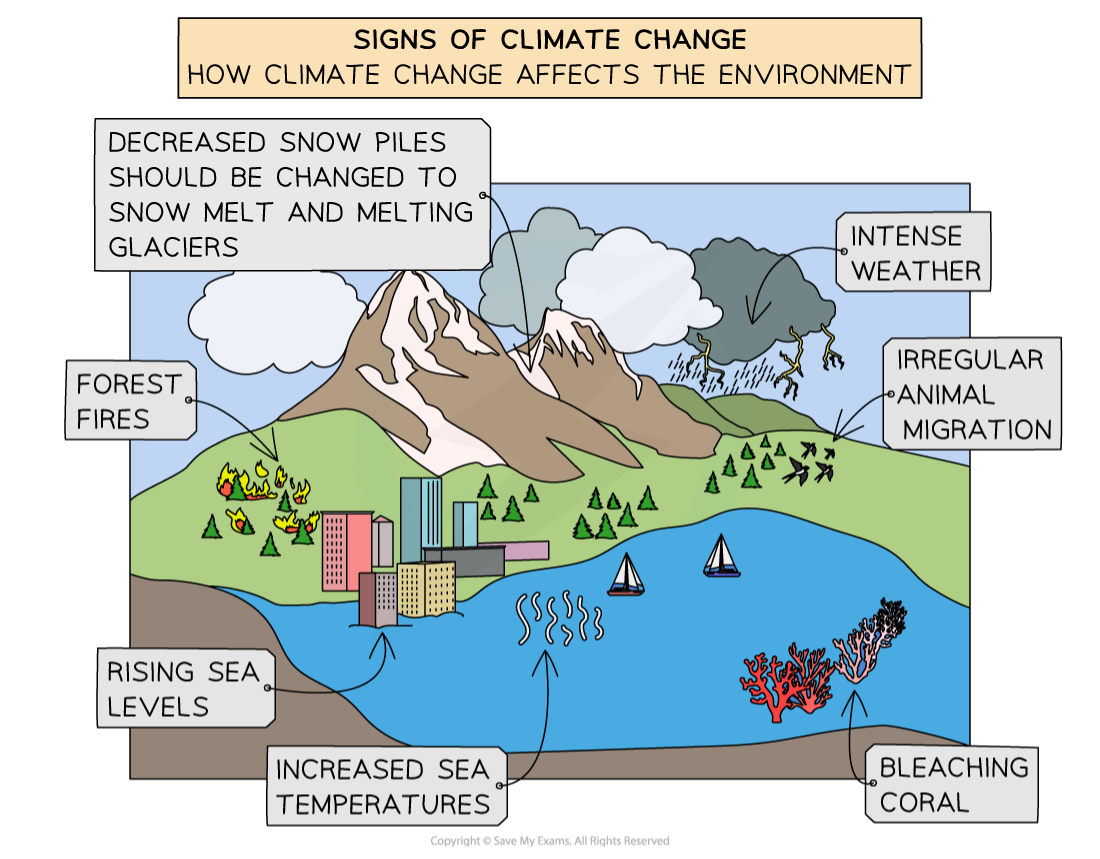
Image source: savemyexams.com
Local impacts
Coral bleaching
- Cause:
- Increased sea temperatures cause corals to expel the algae (zooxanthellae) living in their tissues
- Without these algae, corals lose their colour (giving them a white appearance)
- They also lose their main food source (the algae perform photosynthesis, producing organic compounds that the corals use as a primary energy source)
- This leads to bleaching and eventually coral death
- Effects:
- Loss of biodiversity as fish and other marine species lose their habitat
- Decline in fish populations in reef ecosystems
- Example:
- The Great Barrier Reef in Australia has experienced significant coral bleaching events
Desertification
- Cause:
- Prolonged droughts and higher temperatures
- Unsustainable land practices like deforestation and overgrazing
- Effects:
- Loss of arable land and vegetation, leading to soil erosion
- Reduced agricultural productivity
- Displacement of communities
- Example:
- The Sahel region in Africa is facing severe desertification, affecting local livelihoods that rely on agriculture

Image source: savemyexams.com
Global impacts
Changes to ocean circulation
- Cause:
- Melting ice caps and glaciers increase the freshwater input into oceans
- This disrupts normal currents and circulation patterns
- Effects:
- Altered weather patterns
- Changes in marine and coastal ecosystems
- Changes in fish migration and distribution affecting fisheries
- Example:
- Slowing down of Atlantic Meridional Overturning Circulation (AMOC), which includes the Gulf Stream
- This is leading to colder winters in Europe and warmer temperatures in the Arctic
Sea-level rise
- Cause:
- Melting ice caps and glaciers
- Thermal expansion of seawater due to higher temperatures
- Effects:
- Coastal flooding and erosion, impacting ecosystems like mangroves and salt marshes
- Loss of habitats for species in these biodiverse ecosystems
- Example:
- The Maldives is at risk of becoming uninhabitable due to rising sea levels
Regional impacts on natural productivity
Increased productivity
- Northern regions:
- Warmer temperatures can extend the growing season and increase vegetation
- Expansion of suitable areas for agriculture and forestry
- For example, in parts of Canada and Russia, agriculture is expanding northward and growing seasons are longer due to warmer conditions
Decreased productivity
- Tropical regions:
- Higher temperatures and unpredictable rainfall can harm crops
- For instance, shifting monsoon patterns in Southeast Asia are threatening rice yields
Factors affecting ecosystem resilience
Biodiversity
- Climate change can reduce resilience by decreasing biodiversity
- High biodiversity:
- Increases resilience by providing a variety of species that can adapt to changes
- For example, tropical rainforests have high biodiversity, helping them recover from disturbances
- Low biodiversity:
- Decreases resilience, making ecosystems more vulnerable
- For example, monoculture farms are less resilient to pests and diseases
- Impact of climate change:
- Climate change can lead to habitat loss, altered food webs and extreme weather events
- All of these can reduce biodiversity
- For example, coral bleaching due to increased sea temperatures reduces the variety of species in coral reefs
- This can reduce the resilience of coral reefs to other stressors, like ocean acidification or increased tropical storms
Habitat fragmentation
- Climate change can also reduce resilience by causing habitat fragmentation
- Connected habitats:
- Enable species to migrate and adapt to changes
- Fragmented habitats:
- Isolate species and split populations, reducing their ability to adapt
- Impact of climate change:
- Rising temperatures and changing precipitation patterns can shift habitats, leading to fragmented landscapes
- Climate change can fragment habitats in various ways:
- Increased desertification: expanding deserts can divide ecosystems, making it harder for species to find resources and migrate
- Increased rates of forest fires: more frequent and intense fires can break up forest ecosystems, isolating populations and reducing biodiversity
- Melting polar ice caps: loss of ice habitats can fragment the habitats of polar species like polar bears and penguins, affecting their ability to hunt and reproduce
- Species in mountainous regions might be forced to move to higher altitudes, creating isolated populations
- These changes reduce the resilience of ecosystems by isolating species and limiting their ability to adapt to new conditions
Biome shifts
- Climate change:
- Impacts ecosystems on various scales, from local to global
- Affects the resilience of ecosystems
- Leads to biome shifts
📌 Impacts of Climate Change on Societies
- Climate change impacts human societies at various scales and socio-economic conditions
- This means that the impacts of climate change affect societies differently based on their:
- Economic status
- Resources
- Social conditions
- Socio-economic conditions include factors like:
- Income levels
- Access to resources
- Quality of infrastructure
- Education
- Healthcare availability
- This means that the impacts of climate change affect societies differently based on their:
- Impacts of climate change also affect the resilience of societies
🔍 TOK Tip: What role does media play in shaping public knowledge of atmospheric science?
Key impacts of climate change
- Key areas of societies that are impacted include health, water supply, agriculture and infrastructure
Health impacts
- Heatwaves:
- Increased frequency and intensity
- These can be especially dangerous for the young and elderly
- E.g. the North American Heatwave 2021:
- A severe and prolonged heatwave hit the Pacific Northwest region of the United States and Western Canada in June 2021
- The extreme heatwave led to:
- Hundreds of deaths across the region
- Overwhelmed hospitals with cases of heat-related illnesses
- Caused power outages as electrical grids struggled to cope with increased demand for air conditioning
- Diseases:
- Warmer temperatures expand habitats for disease-carrying insects
- Leads to spread of vector-borne diseases like malaria and dengue to new areas
- Air quality:
- Poor air quality due to higher temperatures and pollutants:
- Higher temperatures can enhance the formation of ground-level ozone, a harmful air pollutant
- More frequent and severe wildfires release large amounts of smoke and particulate matter into the air
- Climate change can lead to more frequent stagnant air conditions, which prevent pollutants from dispersing
- Poor air quality due to higher temperatures and pollutants:
Water supply impacts
- Droughts:
- Longer and more severe droughts reduce water availability
- E.g. Cape Town’s Day Zero water crisis in 2018
- Melting glaciers:
- Reduces freshwater availability for downstream communities
- E.g. glaciers in the Andes are melting, threatening water supplies in South America
- Flooding:
- More intense rainfall leads to flooding
- Flooding can contaminate drinking water sources with pollutants, sewage and hazardous chemicals, making the water unsafe to drink
- Water Quality:
- Combined with nutrient pollution (e.g. from agricultural runoff), warmer water temperatures promotes the growth of harmful algal blooms
- These blooms produce toxins that can contaminate drinking water
- E.g. algal blooms in Lake Erie in North America have repeatedly made the water unsafe for consumption
Agriculture impacts
- Crop yields:
- Changes in temperature and rainfall affect crop production
- E.g. reduced wheat yields in Australia and India due to heat stress
- Pest outbreaks:
- Warmer climates increase the prevalence of agricultural pests
- Food security:
- Less reliable food supply and higher prices
- Livestock:
- Heat stress affects livestock health and productivity
- E.g. heat stress in dairy cows decreases their milk yield
Infrastructure impacts
- Extreme weather:
- More frequent hurricanes, floods and storms damage infrastructure
- Transportation:
- Roads and railways damaged by extreme weather
- E.g. UK railways have been disrupted by flooding and heat in recent years
- Buildings:
- Increased costs for cooling
- Increased cost of repairs from storm damage
- Coastal erosion damages properties on seafronts
- Energy supply:
- Power outages from extreme weather affecting grids
Resilience of societies
- Resilience refers to a society’s ability to withstand, adapt to and recover from climate change impacts
- Different factors contribute to the resilience of societies, including economic stability, social equity and adaptive capacity
- Economic stability:
- Economic resources are crucial for repairing and rebuilding after climate-related disasters
- E.g. the cost of rebuilding after hurricanes can strain local economies, but wealthier regions have more resources to recover quickly
- Social equity:
- Vulnerable communities, such as low-income or marginalised groups, are often more severely affected by climate change
- Adaptive capacity:
- The ability to adapt to climate change varies significantly between regions and countries
- E.g. the Netherlands has advanced flood defences, while Bangladesh remains highly vulnerable to flooding due to limited resources
- Individual experiences, societal values, and policies all influence perspectives on climate change
- These perspectives shape how people and societies respond to climate challenges
Individual perspectives
- People’s own experiences with climate change shape their awareness and concern
- For example, farmers noticing changes in growing seasons may be more aware of climate impacts than urban residents
- Individuals can take personal steps to mitigate their contributions to climate change
- E.g. by reducing their carbon footprint, such as using public transport or reducing energy consumption
- Personal health concerns may influence perspectives on climate action
- E.g. parents in polluted urban areas may be concerned about children’s asthma
Societal perspectives
- Government policies play an important role in mitigating and adapting to climate change
- E.g. UK’s commitment to net-zero carbon emissions by 2050
- Local communities often take initiatives to enhance resilience and reduce climate impacts
- E.g. urban community gardens may help to improve food security and reduce heat island effects
- Cultural values and traditions influence how societies perceive and respond to climate change
- For example, indigenous communities may incorporate traditional ecological knowledge into their adaptation strategies
- This might include adjusting agricultural practices based on seasonal changes observed over many generations