A1.2- NUCLEIC ACIDS
Author: Admin
-
-
A1.1- WATER
-
A4.2.3 – CONSERVATION STRATEGIES
📌Definition Table
Term Definition In situ Conservation Protection of species in their natural habitat. Ex situ Conservation Protection of species outside their natural habitat. Rewilding Reintroducing species and restoring ecosystems to their natural state. EDGE Species Evolutionarily Distinct and Globally Endangered species; high priority for conservation. Seed Bank Facility that stores seeds under controlled conditions to preserve genetic diversity. Tissue Bank Storage of living tissue or cells for future use in breeding or research. Protected Area Region designated for biodiversity conservation, such as national parks or reserves. 📌Introduction
Conservation strategies aim to preserve biodiversity, maintain ecosystem services, and protect endangered species. Effective conservation requires understanding species’ ecological roles, threats to their survival, and the socio-political context. Strategies can be in situ (protecting species in their natural environment) or ex situ (maintaining them outside their natural range). Often, a combination of both is used for long-term success.
❤️ CAS Link: Partner with a wildlife NGO to create an educational campaign comparing in situ and ex situ methods using local examples.
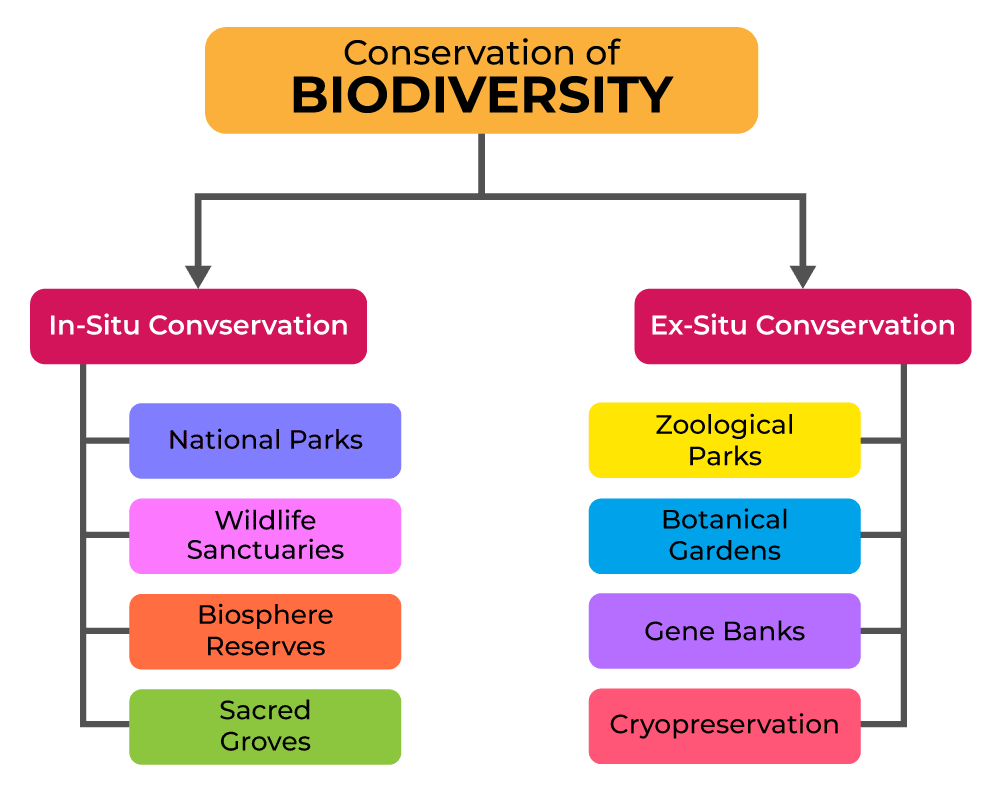
📌 In Situ Conservation
- Protects species in their natural habitats.
- Examples: national parks, wildlife sanctuaries, marine protected areas.
- Benefits: maintains natural behaviours, ecosystem interactions, and evolutionary processes.
- Drawbacks: may not protect against all threats, such as poaching or invasive species.
- Rewilding involves restoring ecosystems and reintroducing species to historical ranges.
🧠 Examiner Tip: When comparing in situ and ex situ, focus on ecological realism vs. control over conditions.
📌 Ex Situ Conservation
- Protects species outside their natural habitats.
- Methods:
- Zoos and aquariums (breeding programs).
- Botanic gardens (rare plant cultivation).
- Seed and tissue banks (long-term genetic storage).
- Advantages: allows close monitoring, protects from immediate threats.
- Disadvantages: may not prepare organisms for reintroduction; costly.
🌍 Real-World Connection: The Millennium Seed Bank in the UK stores over 2.4 billion seeds, safeguarding plant genetic diversity.
📌Species Selection for Conservation
Criteria for priority:
- Endangered status (IUCN Red List).
- Ecological role (keystone species).
- Cultural or economic importance.
- EDGE species status — combining evolutionary uniqueness with high endangerment.
🔍 TOK Perspective: Ethical debates arise over whether to prioritise charismatic species or those most critical for ecosystem function.
📌 Global and Local Conservation Efforts
International agreements:
- CITES — Convention on International Trade in Endangered Species.
- CBD — Convention on Biological Diversity.
Local measures: habitat restoration projects, wildlife corridors, community-led conservation.
Public engagement and education increase long-term success.
📝 Paper 2: Data Response Tip: When given conservation success/failure data, link results to method choice and threat mitigation.
-
A4.2.2 – THREATS TO BIODIVERSITY
📌Definition Table
Term Definition Anthropogenic Extinction Species loss caused directly or indirectly by human activities. Mass Extinction Event where a significant proportion of species become extinct in a short time. Overexploitation Unsustainable harvesting of resources leading to population decline or extinction. Invasive Species Non-native species that disrupt ecosystems by outcompeting native species. Habitat Loss Destruction or alteration of natural environments, reducing biodiversity. Pollution Introduction of harmful substances into the environment, impacting species survival. Climate Change Long-term shifts in temperature, precipitation, and weather patterns affecting species and ecosystems. 📌Introduction
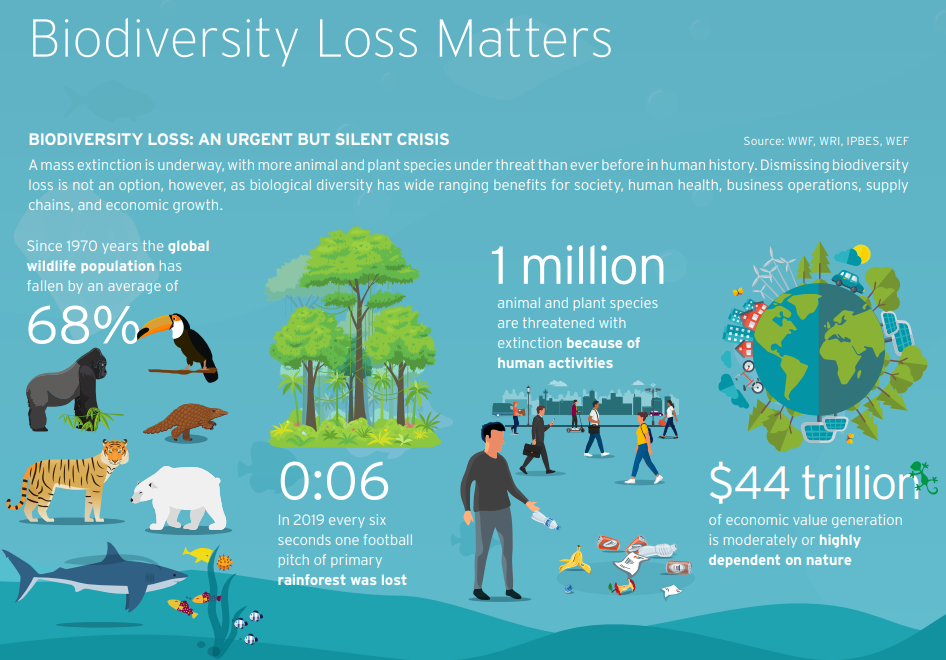
Biodiversity faces unprecedented threats from human activities, leading to what many scientists call the sixth mass extinction. Unlike previous mass extinctions caused by natural events, the current one is driven primarily by human-induced pressures. The loss of biodiversity threatens ecosystem stability, disrupts ecological processes, and reduces the ecosystem services essential for human survival.
❤️ CAS Link: Organise a “Biodiversity Under Threat” awareness day with interactive displays on local endangered species and their threats.
📌 Anthropogenic Extinction
- Current extinction rates are estimated to be 100–1000 times higher than the natural background rate.
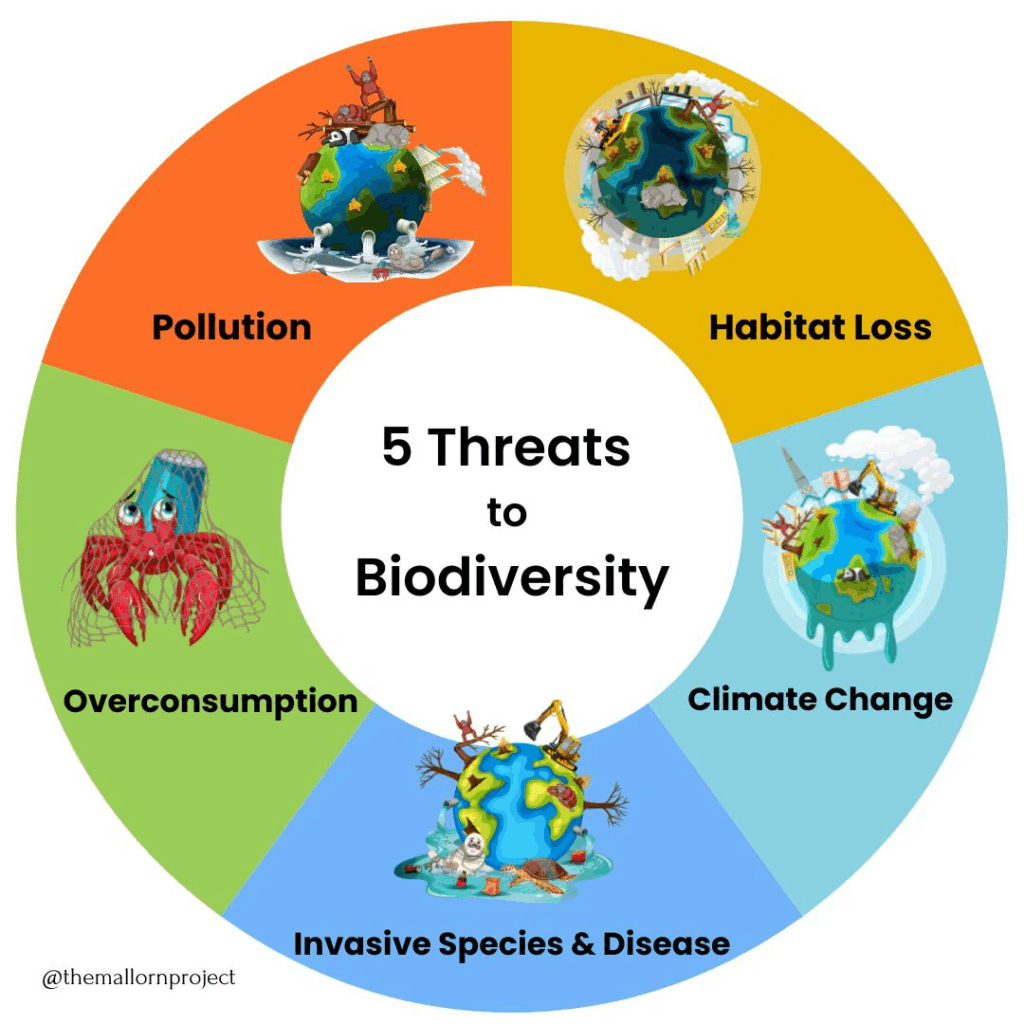
- Causes include habitat destruction, overexploitation, pollution, introduction of invasive species, and climate change.
- Example: North Island giant moa (Dinornis novaezealandiae) driven to extinction by overhunting by early humans in New Zealand.
🧠 Examiner Tip: Use named examples to support descriptions of extinction causes.
📌 Case Studies of Species Loss
- North Island giant moa — overhunting and habitat loss by early settlers.
- Caribbean monk seal — hunted for oil and meat, declared extinct in 2008.
- Student choice species — research and apply same analytical framework to a relevant local example.
🌍 Real-World Connection: IUCN Red List data provides global assessments of species status, guiding conservation priorities.
📌 Habitat Loss and Degradation
- Primary driver of biodiversity decline worldwide.
- Includes deforestation, clear-cutting, land conversion for agriculture, and urbanisation.
- Example: Tropical rainforest destruction for palm oil plantations reduces both species richness and genetic diversity.
🔍 TOK Perspective: Trade-offs between economic development and conservation highlight the influence of cultural and political values on biodiversity protection.
📌 Evidence for Biodiversity Loss
- IPBES Reports — highlight trends and drivers of biodiversity decline globally.
- IUCN Red List — monitors changes in species’ conservation status.
- Citizen Science — large-scale biodiversity data collection by non-professionals (e.g., bird counts).
🌐 EE Focus: An EE could analyse the relative impact of different threats on a chosen ecosystem using quantitative biodiversity indices.
📌 Major Threat Factors
- Overexploitation — overfishing, logging, poaching.
- Invasive species — e.g., cane toad in Australia, zebra mussel in North America.
- Pollution — plastic pollution, agricultural runoff, oil spills.
- Climate change — shifting ranges, coral bleaching, altered migration patterns.
- Disease — emerging infectious diseases affecting wildlife populations.
📝 Paper 2: Data Response Tip: Link numerical trends directly to causes — avoid simply stating “it decreased” without explaining why.
-
A4.2.1 – BIODIVERSITY AND ITS IMPORTANCE
📌Definition Table
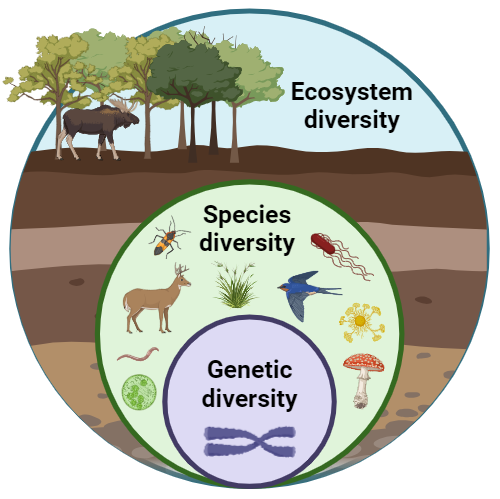
Term Definition Biodiversity Variety of life at all levels: genetic, species, and ecosystem. Genetic Diversity Variation of alleles within a population’s gene pool. Species Diversity Variety of species in an ecosystem, measured by richness and evenness. Species Richness Number of different species present in a given area. Species Evenness Relative abundance of each species in an ecosystem. Ecosystem Diversity Variety of habitats, communities, and ecological processes in the biosphere. Endemism Species found only in a specific geographic location. 📌Introduction
Biodiversity encompasses the full range of life forms on Earth and the natural patterns they form. It exists at three main levels — genetic, species, and ecosystem — and is vital for ecological stability, resilience, and the provision of ecosystem services. High biodiversity generally means greater ecosystem resilience, while low biodiversity can make systems more vulnerable to disturbances.
❤️ CAS Link: Partner with a local park authority to create an illustrated biodiversity map of the area, showcasing species richness and endemism
📌 Levels of Biodiversity
- Genetic Diversity — High genetic variation allows species to adapt to environmental change and resist diseases.
- Species Diversity — Measured by:
- Richness (number of species present).
- Evenness (balance of population sizes among species).
- Ecosystem Diversity — Range of different habitats and communities within a region, e.g., tropical rainforest vs. desert.
🧠 Examiner Tip: When given data, use both richness and evenness to assess biodiversity — not just species counts.
📌 Examples of High vs. Low Biodiversity
- High biodiversity: Coral reefs (many species, balanced abundances, high genetic diversity).
- Low biodiversity: Monoculture crop fields (few species, low genetic variation).
- Biodiversity hotspots are regions with high species richness and high levels of endemism (e.g., Madagascar, Amazon rainforest).
🌍 Real-World Connection: Conservation International identifies 36 global biodiversity hotspots covering 2.3% of Earth’s land surface yet hosting over 50% of endemic plant species.
📌Biodiversity Over Time
- Biodiversity changes through speciation (formation of new species) and extinction.
- Natural extinctions are balanced by speciation over geological timescales.
- Mass extinction events dramatically reduce biodiversity but can be followed by adaptive radiation.
- Current biodiversity loss rates are 100–1000× the natural background rate due to human activities.
🔍 TOK Perspective: Biodiversity measures are human-defined — debates exist on whether priority should be given to species count or ecosystem health.
📌 Classification Approaches and Biodiversity Recording
- Scientists group species using taxonomic principles, but classification approaches differ:
- Lumpers — place similar organisms into fewer, broader groups.
- Splitters — create more categories based on subtle differences.
- Accurate classification is essential for biodiversity monitoring, especially for conservation decisions.
- Pattern recognition is used to identify relationships and track changes in diversity.
📝 Paper 2: Data Response Tip: If given biodiversity data before and after disturbance, calculate % change and explain with ecological reasoning (e.g., loss of evenness, habitat destruction).
-
A3.1.3 – EVOLUTIONARY RELATIONSHIPS AND BIODIVERSITY
📌Definition Table
Term Definition Phylogeny Evolutionary history and relationships among species or groups of organisms. Common Ancestor An ancestral species from which later species evolved. Adaptive Radiation Evolution of many species from a common ancestor into different niches. Convergent Evolution Independent evolution of similar traits in unrelated species. Biodiversity Variety of life in all its forms, including species, genetic, and ecosystem diversity. Conservation Biology Study and practice of protecting biodiversity and natural resources. 📌Introduction
Evolutionary relationships show how different organisms are linked by common ancestry and how life has diversified over time. Biodiversity — at genetic, species, and ecosystem levels — is a result of millions of years of evolutionary processes. Protecting biodiversity is critical for ecosystem health, resilience, and the services they provide to humans.
❤️ CAS Link: Partner with a local environmental group to conduct a tree-planting and biodiversity awareness campaign linking conservation to evolutionary principles.
📌 Concept of Common Ancestry and Evolutionary Trees
- Phylogenetic trees represent hypothesised evolutionary relationships.
- Branch points (nodes) indicate a common ancestor.
- The closer two species are on a tree, the more recent their shared ancestor.
- Trees are constructed using morphological and molecular data.
- Shared derived traits (synapomorphies) help identify related groups.
- Evolutionary trees are constantly revised with new genetic data.
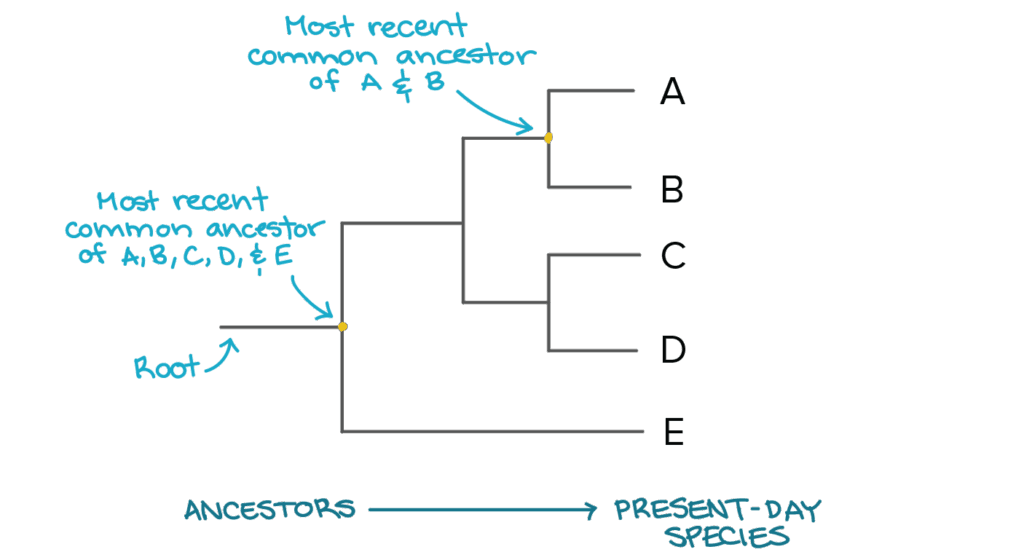
🧠 Examiner Tip: When describing a phylogenetic tree, refer to branch points — avoid simply listing species in order.
📌 Evidence for Evolutionary Relationships
- Fossil Record: Shows changes in species over time and transitional forms.
- Comparative Anatomy: Homologous structures indicate shared ancestry.
- Embryology: Similar early development stages across species suggest common origins.
- Molecular Evidence: DNA, RNA, and protein sequence similarities.
- Biogeography: Geographic distribution of species supports evolution from common ancestors.
- Observable Evolution: Example — antibiotic resistance in bacteria.
🌍 Real-World Connection: Molecular phylogenetics is used to track viral outbreaks, such as tracing the origin of COVID-19 strains.
📌Adaptive Radiation and Convergent Evolution
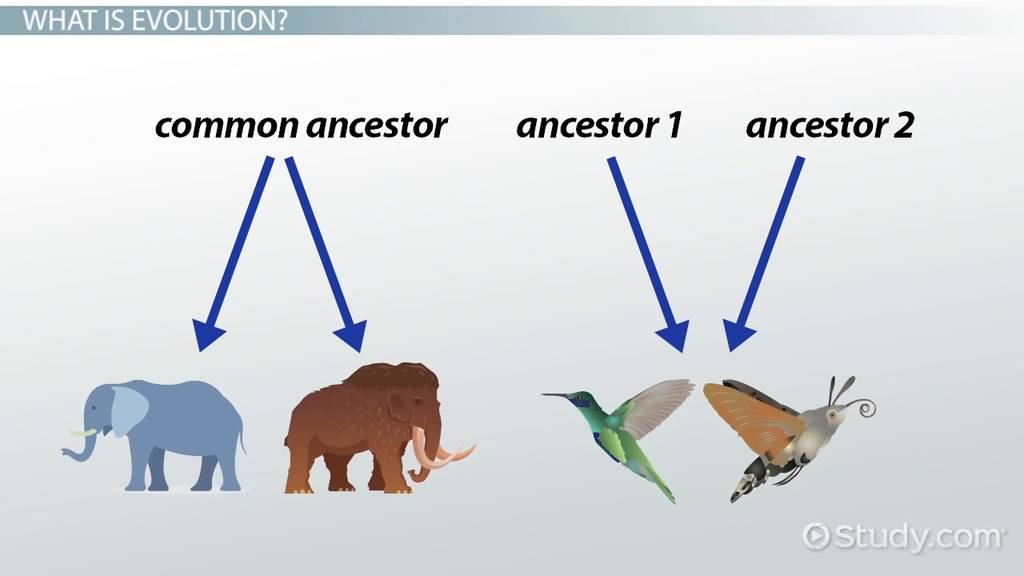
- Adaptive Radiation: Diversification from a common ancestor into many forms adapted to different niches (e.g., Darwin’s finches).
- Convergent Evolution: Unrelated species evolve similar traits due to similar environmental pressures (e.g., wings in bats and birds).
- Adaptive radiation increases biodiversity by producing many species in a short evolutionary period.
- Convergent evolution can complicate classification if based only on morphology.
- Both processes highlight the role of environment in shaping biodiversity.
- Examples often come from isolated ecosystems like islands.
🌐 EE Focus: An EE could analyse morphological divergence in species from a single island to study adaptive radiation.
📌 Importance of Biodiversity
- Provides ecosystem services (pollination, nutrient cycling, water purification).
- Increases ecosystem resilience to disturbances.
- Source of food, medicine, and raw materials.
- Genetic diversity within species aids adaptation to changing environments.
- Cultural and aesthetic value to human societies.
- Loss of biodiversity can lead to ecosystem collapse.
🔍 TOK Perspective: Conservation priorities often reflect human values — how do ethics influence which species we protect?
📌 Human Impact and Conservation Strategies
- Habitat destruction, pollution, overexploitation, and climate change reduce biodiversity.
- Invasive species outcompete native species.
- Conservation strategies include protected areas, captive breeding, habitat restoration, and legislation.
- Genetic analysis helps identify populations most in need of protection.
- Global agreements (e.g., CITES, CBD) coordinate conservation efforts.
- Public education is critical for long-term success.
📝 Paper 2: Data Response Tip: For biodiversity data, link numerical trends directly to causes and consequences — don’t just describe patterns.
-
A3.1.2 – DOMAINS AND KINGDOMS OF LIFE
📌Definition Table
Term Definition Domain Highest taxonomic rank grouping organisms based on fundamental differences in cell type and genetics. Kingdom Second-highest rank in taxonomy grouping related organisms within a domain. Prokaryote Organism without a true nucleus or membrane-bound organelles. Eukaryote Organism with a true nucleus and membrane-bound organelles. Extremophile Organism (often Archaea) that thrives in extreme environments. Phylogenetic Tree Diagram showing evolutionary relationships based on shared traits and genetic data. 📌Introduction
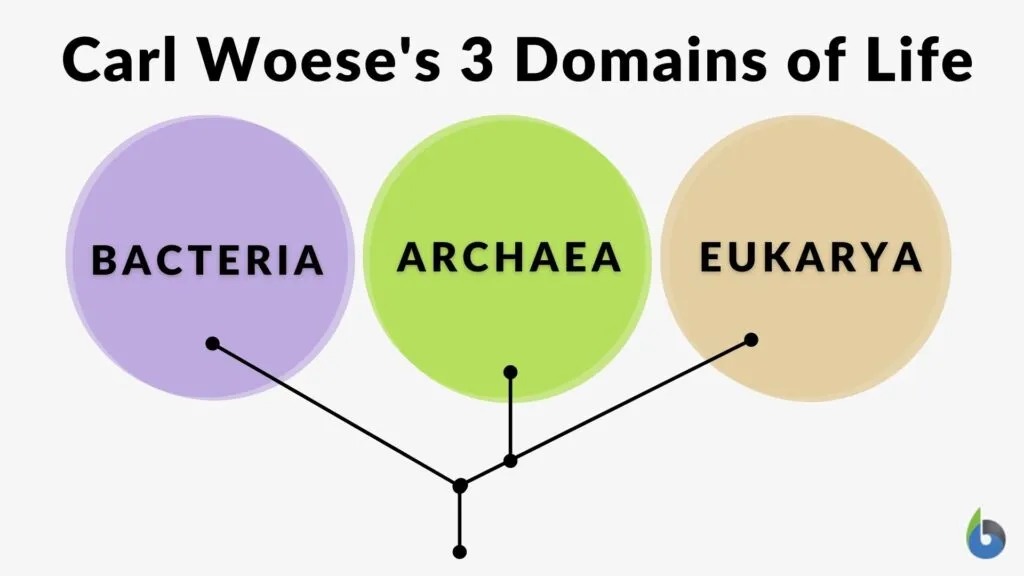
The three-domain system — Bacteria, Archaea, and Eukarya — reflects fundamental differences in genetic makeup, cell structure, and metabolism. Within these domains, organisms are divided into kingdoms based on shared characteristics. Understanding these divisions helps biologists map the tree of life and explore evolutionary relationships.
❤️ CAS Link: Create a classroom display mapping the three domains and their kingdoms, using local examples of species where possible.
📌 Three-Domain System
- Bacteria: Prokaryotic, cell walls with peptidoglycan, diverse metabolic pathways.
- Archaea: Prokaryotic, no peptidoglycan in cell walls, often extremophiles (e.g., thermophiles, halophiles).
- Eukarya: Eukaryotic cells with nuclei and membrane-bound organelles.
- Domains were proposed by Carl Woese based on molecular evidence (16S rRNA analysis).
- Reflects the deepest evolutionary splits among living organisms.
- Each domain contains multiple kingdoms.
🧠 Examiner Tip: When asked for differences between domains, always include cell wall composition, membrane lipids, and genetic machinery.
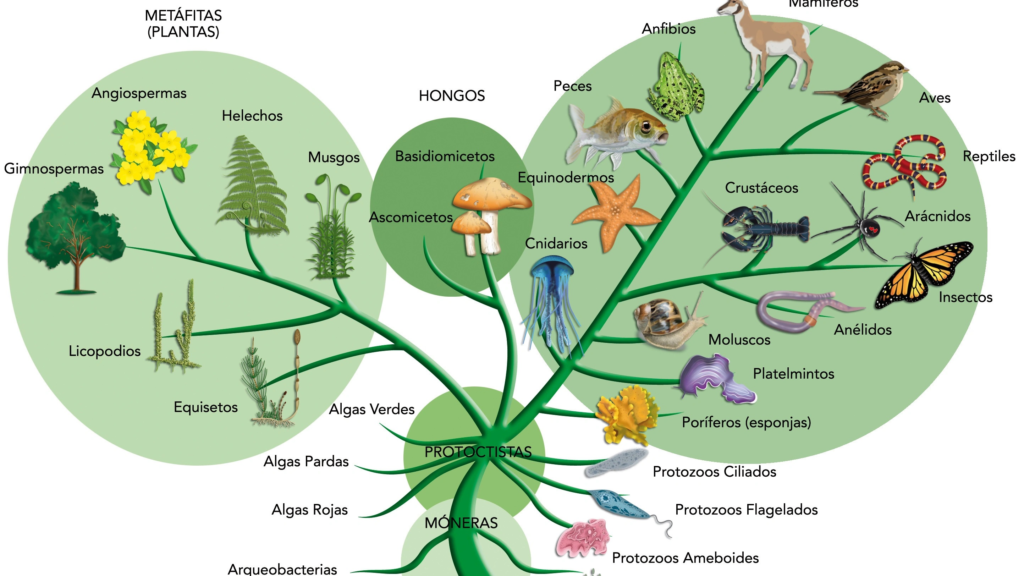
📌 Kingdoms of Life in the Three-Domain System
- Bacteria: Single kingdom, highly diverse, includes cyanobacteria and heterotrophic bacteria.
- Archaea: Single kingdom, includes methanogens, extreme halophiles, and thermophiles.
- Eukarya: Multiple kingdoms — Animalia, Plantae, Fungi, Protista.
- Protista is a diverse group, often considered “miscellaneous” eukaryotes.
- Each kingdom is defined by cell type, nutrition mode, and reproduction methods.
- Molecular studies are reshaping traditional kingdom classifications.
🌍 Real-World Connection: Understanding bacterial diversity aids in biotechnology applications, such as antibiotic production and waste treatment.
📌 Key Features of Each Domain
- Bacteria: Circular DNA, 70S ribosomes, peptidoglycan cell walls, reproduce by binary fission.
- Archaea: Unique membrane lipids, no peptidoglycan, histone-like proteins, live in diverse and extreme environments.
- Eukarya: Linear DNA, 80S ribosomes, compartmentalised organelles, complex reproduction cycles.
- Distinguishing features often determined through molecular data.
- Genetic differences support the ancient divergence of domains.
- Cell wall and membrane composition are critical identifiers.
🔍 TOK Perspective: The decision to move from a two- to three-domain system shows how paradigm shifts occur in science when new evidence challenges old models.
📌 Examples and Ecological Roles
- Bacteria: Nitrogen-fixing Rhizobium, decomposers, pathogens (E. coli).
- Archaea: Methanogens in cow guts (methane production), thermophiles in hot springs.
- Animalia: Multicellular heterotrophs, from sponges to mammals.
- Plantae: Autotrophic producers, base of food chains.
- Fungi: Decomposers, symbionts (mycorrhizae), pathogens.
- Protista: Diverse aquatic organisms like algae and protozoa.
- Each group plays essential roles in nutrient cycling, energy flow, and ecosystem stability.
📝 Paper 2: Data Response Tip: For classification tables, use exact terminology (e.g., “peptidoglycan” not just “cell wall”) to secure precision marks.
-
A3.1.1 – CLASSIFICATION AND TAXONOMY
📌Definition Table
Term Definition Taxonomy The science of naming, describing, and classifying organisms. Binomial Nomenclature System of giving each species a two-part scientific name (genus + species). Hierarchical Classification Arrangement of organisms into nested groups from broad to specific categories. Phylogenetics Study of evolutionary relationships among species. Morphological Traits Physical characteristics used for classification. Molecular Phylogenetics Use of DNA, RNA, and protein sequences to determine evolutionary relationships. 📌Introduction
Classification allows scientists to organise and communicate biological information, making it easier to study, identify, and understand organisms. This system helps reveal evolutionary relationships and track biodiversity. Taxonomy uses morphological, biochemical, and molecular data to place organisms into groups that reflect their ancestry.
❤️ CAS Link: Lead a biodiversity survey in a local park, collecting and classifying organisms using a simplified field guide for community education.
📌 Importance of Classification in Biology
- Provides a universal language for scientists across the world.
- Helps avoid confusion from common names, which can vary between regions and languages.
- Organises knowledge of the vast diversity of life into manageable categories.
- Reveals evolutionary relationships among organisms.
- Assists in predicting characteristics of organisms based on their group.
- Essential for biodiversity monitoring and conservation planning.
🧠 Examiner Tip: Always explain that classification is based on shared characteristics and increasingly on genetic evidence — this is a common IB mark point.
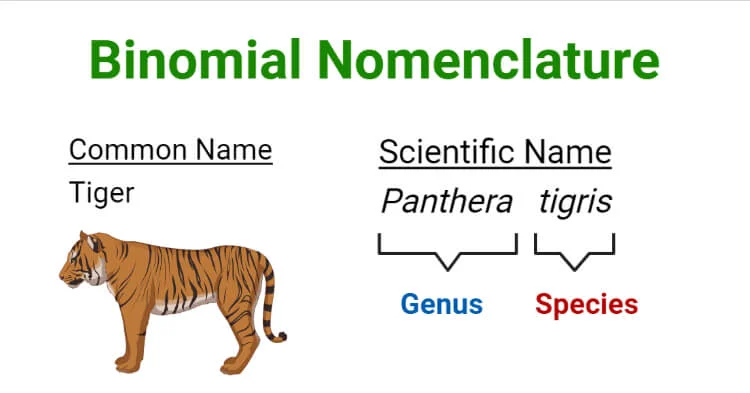
📌 Binomial Nomenclature System
- Developed by Carl Linnaeus in the 18th century.
- Each species has a two-part name:
- Genus (capitalised)
- Species (lowercase)
- Written in italics or underlined when handwritten.
- Provides a unique and standardised name for every organism.
- Reduces ambiguity in scientific communication.
- Example: Homo sapiens (humans).
🌍 Real-World Connection: Binomial nomenclature is used in medicine to identify pathogens precisely, avoiding dangerous miscommunication.
📌 Hierarchical Classification Levels
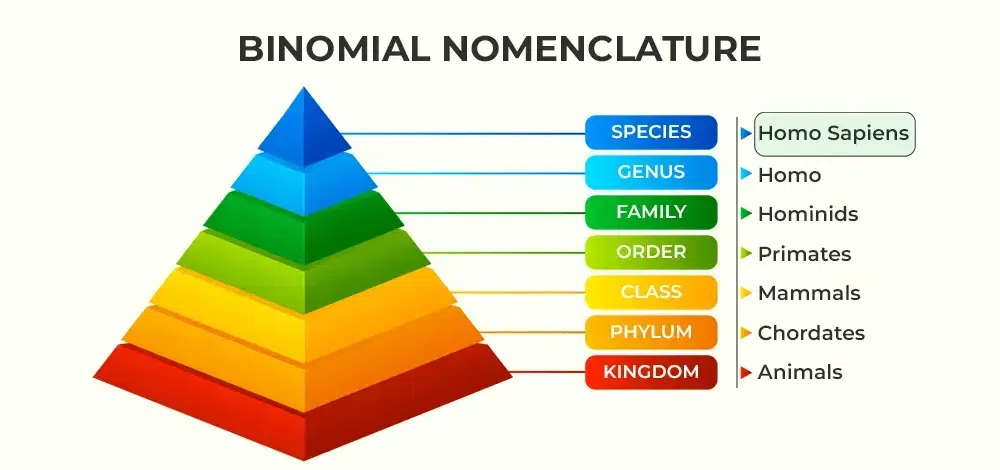
- Domain → Kingdom → Phylum → Class → Order → Family → Genus → Species.
- Domains represent the broadest groupings; species is the most specific.
- Each level groups organisms that share certain characteristics.
- Organisms become more similar to each other as you move down the hierarchy.
- Mnemonics like “Dear King Philip Came Over For Good Soup” help memorise the order.
- Modern classification increasingly uses genetic data to refine groupings.
🌐 EE Focus: An EE could compare morphological vs molecular classification in a particular group of organisms (e.g., flowering plants, fish).
📌 Criteria for Classification
- Morphological: Shape, structure, anatomy.
- Physiological: Metabolism, reproduction, life cycle.
- Biochemical: Enzyme composition, metabolic pathways.
- Genetic: DNA, RNA, and protein sequence similarities.
- Ecological: Habitat, niche, interactions with other organisms.
- Combining multiple criteria provides a more accurate classification.
🔍 TOK Perspective: How do advances in technology (e.g., DNA sequencing) influence our perception of how life should be classified?
📌 Role of Molecular Phylogenetics
- Uses DNA and protein sequences to determine evolutionary relationships.
- Reveals hidden similarities not visible morphologically.
- Helps correct misclassifications based on convergent evolution.
- Can reconstruct evolutionary trees (phylogenies).
- Identifies relationships among extinct species through ancient DNA.
- Plays a role in tracking the evolution of pathogens.
📝 Paper 2: Data Response Tip: When interpreting phylogenetic trees, follow branch points carefully and note that closer branches indicate more recent common ancestors.
-
A3.2.2 – CLADISTICS
📌Definition Table
Term Definition Cladistics Method of classifying organisms based on shared ancestry and evolutionary relationships. Clade A group of organisms that have all descended from a common ancestor. Monophyletic Group A clade containing all descendants of a single common ancestor. Primitive Trait A characteristic that evolved early in the history of a clade and is shared by all its members. Derived Trait A characteristic that evolved later in some members of a clade, but not all. Molecular Clock The concept that mutations accumulate at a relatively constant rate, allowing estimation of divergence times. Parsimony Principle The idea that the simplest explanation, involving the fewest evolutionary changes, is preferred. 📌Introduction
Cladistics focuses on grouping organisms into clades based solely on evolutionary descent from a common ancestor, rather than superficial similarity. Advances in molecular biology, especially DNA sequencing, have made it possible to reconstruct phylogenies with greater accuracy. Cladograms, the visual representation of these relationships, are hypotheses that are continually refined as new evidence emerges.
❤️ CAS Link: Create a school-wide “evolutionary tree mural” showing local species arranged into clades using genetic and morphological data.
📌 Principles of Cladistics
- Groups organisms into clades based on common ancestry.
- Every member of a clade shares a most recent common ancestor not shared with any outside group.
- Clades are monophyletic — all descendants of the common ancestor are included.
- Taxonomy names and organises species; cladistics focuses purely on evolutionary links.
- Correct taxonomy should match clades, but historical errors often cause mismatches.
🧠 Examiner Tip: In questions comparing taxonomy and cladistics, emphasise ancestry vs. appearance.
📌 Evidence Used in Cladistics
- Sequence Data – DNA, mRNA, and amino acid sequences; greater similarity means closer relationship.
- Molecular Clock – Number of sequence differences estimates time since divergence.
- Morphology – Observable traits, used with caution due to convergent evolution.
- Primitive vs. Derived Traits –
- Primitive: Present in all members of a clade (e.g., all vertebrates have spinal cords).
- Derived: Evolved later in some members (e.g., feathers in birds vs. fur in mammals).
🌍 Real-World Connection: Cladistics is used in forensic science to trace the evolutionary source of pathogens in criminal cases.
📌 Constructing Cladograms
- Cladograms show probable order of divergence and relationships.
- Nodes represent common ancestors; the root represents the oldest ancestor of all species shown.
- Built using parsimony principle — fewest evolutionary changes for the simplest tree.
- Sequence data from multiple genes increases reliability.
- Cladograms are hypotheses and may change with new evidence.
🔍 TOK Perspective: Different datasets can produce different cladograms — highlights how scientific conclusions depend on chosen evidence and methods.
📌 Analysing Cladograms
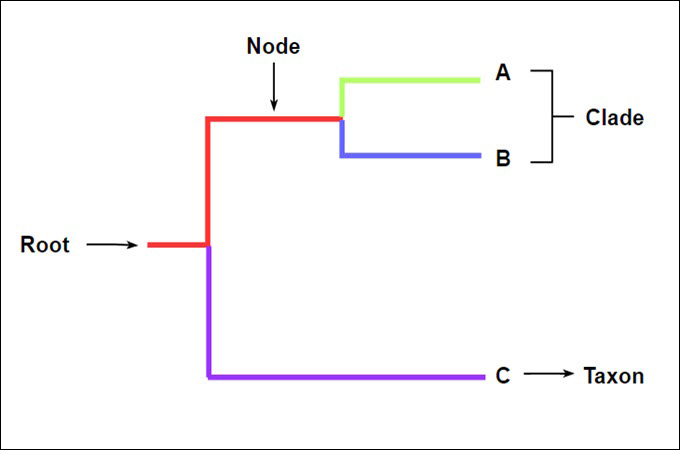
- Nodes closest to two clades show a more recent common ancestor.
- Greater branch length or more sequence differences indicates greater evolutionary distance.
- Some diagrams include a timescale; others show only branching patterns.
- Numbers on branches may represent base or amino acid changes, usable as a molecular clock.
- Relationships are relative — a cladogram shows closeness, not exact divergence dates without molecular data.
📝 Paper 2: Data Response Tip: When analysing a cladogram, state which clades share the most recent common ancestor rather than just describing left-to-right order.
-
A3.2.1 – BIOLOGICAL CLASSIFICATION
📌Definition Table
Term Definition Taxonomy The science of classifying organisms into groups based on shared characteristics. Taxon (Taxa) A group of organisms in a classification system (e.g., species, genus, family). Hierarchy System in which larger groups contain smaller, non-overlapping groups. Morphology Study of the form and structure of organisms. Introgression Transfer of genetic material from one species to another via repeated backcrossing. Genome Sequencing Determining the complete DNA sequence of an organism’s genome. 📌Introduction
Biological classification organises Earth’s biodiversity into a structured system that reflects evolutionary relationships and facilitates scientific communication. From early morphology-based systems to modern genome-informed taxonomy, classification underpins conservation, research, and disease control. Without it, species could be misidentified, conservation priorities misplaced, and evolutionary history misunderstood.
❤️ CAS Link: Organise a school biodiversity survey, classifying plant species using morphological traits, then compare results to DNA barcoding data.
📌 Purpose and Importance of Classification
- Allows scientists to accurately record and identify species, preventing duplication.
- Reveals evolutionary relationships between species and their common ancestry.
- Aids in conservation — cannot protect species if they are not recognised as distinct.
- Supports medical research by identifying related species with useful traits.
- Enables rapid response to new diseases (e.g., COVID-19 classified as a coronavirus).
🧠 Examiner Tip: Always mention evolutionary relationships and practical applications when asked why classification is important.
📌 Hierarchy of Taxa
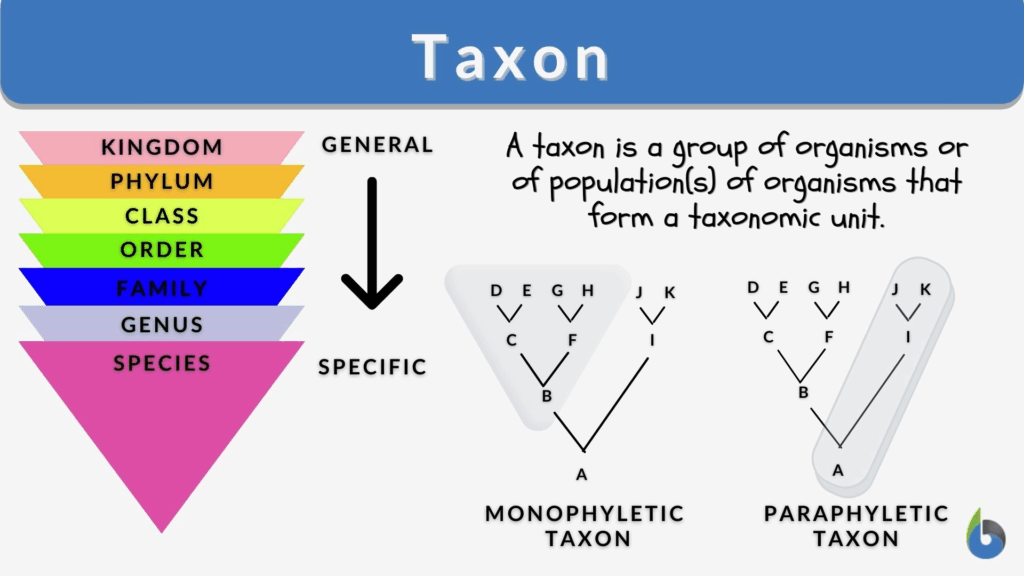
- Traditional classification has fixed ranks: Domain → Kingdom → Phylum → Class → Order → Family → Genus → Species.
- Larger groups contain smaller, non-overlapping groups.
- Example:
- Wolf: Domain Eukaryote, Kingdom Animalia, Phylum Chordata, Class Mammalia, Order Carnivora, Family Canidae, Genus Canis, Species lupus.
- Hibiscus: Domain Eukaryote, Kingdom Plantae, Phylum Angiospermae, Class Dicotyledonae, Order Malvales, Family Malvaceae, Genus Hibiscus, Species rosa-sinensis.
🌐 EE Focus: An EE could explore how phylogenetic evidence has reshaped specific taxonomic ranks over time.
📌 Challenges in Classification
- Morphology Limitations – Similar features can evolve independently through convergent evolution (e.g., streamlined bodies in dolphins and sharks).
- Taxonomic Rank Issues – Hybridisation and evolutionary complexity can make placement difficult, sometimes requiring major reorganisation of ranks.
- Species Boundaries – Defining a species is subjective; gene flow via introgression blurs distinctions (e.g., Neanderthal DNA in modern humans).
🔍 TOK Perspective: The taxonomic hierarchy is a human-made structure; in nature, differences between organisms often occur on a continuum.
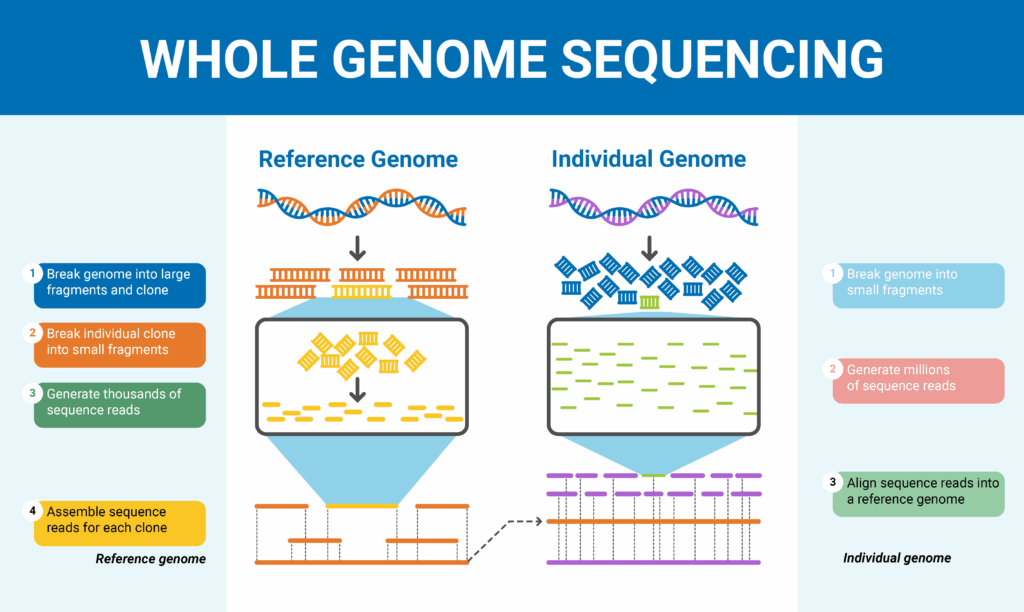
📌Role of Genome Sequencing
- Provides objective genetic data for classification.
- Identifies evolutionary relationships that are not obvious from morphology.
- Allows reclassification when genetic evidence contradicts earlier systems.
- Forms the foundation for cladistics, which groups organisms purely by shared ancestry rather than fixed ranks.
📝 Paper 2: Data Response Tip: When interpreting classification tables, link taxa to shared ancestry rather than listing categories in isolation.