Author: Admin

  • TermDefinition
    Hydrogen BondWeak electrostatic attraction between a δ⁺ hydrogen atom (bonded to an electronegative atom) and a δ⁻ atom (commonly oxygen or nitrogen) in another molecule.
    PolarityUnequal sharing of electrons in a covalent bond leading to regions of partial charge.
    DipoleA molecule with distinct regions of δ⁺ and δ⁻ charges due to polarity.
    CohesionAttraction between molecules of the same type (e.g., water–water via hydrogen bonds).
    AdhesionAttraction between water molecules and other polar/charged substances.
    SolventA liquid that dissolves solutes to form a solution; water is considered the universal solvent.

    Water is the most fundamental biological molecule and is central to life processes. It constitutes 70–95% of the mass of living cells and serves as the medium for biochemical reactions, a solvent for metabolites, and a regulator of temperature. Water’s biological importance stems directly from its polarity and its capacity to form hydrogen bonds. These hydrogen bonds are individually weak but collectively powerful, giving water unique physical and chemical properties that underpin processes such as nutrient transport, enzyme catalysis, temperature stability, and macromolecular stability. Life on Earth is so dependent on water that the search for life on other planets begins with looking for its presence.

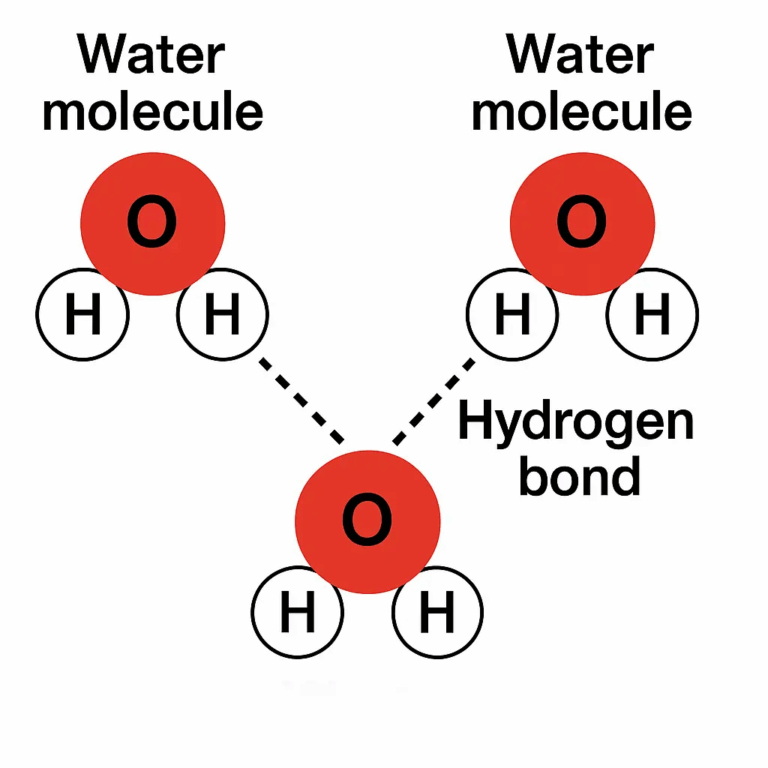
    • A water molecule consists of one oxygen atom covalently bonded to two hydrogen atoms in a bent shape (~104.5Β° bond angle).
    • Oxygen’s higher electronegativity causes electrons to be shared unequally, creating δ⁻ charge on oxygen and δ⁺ charges on hydrogens.
    • This results in a polar molecule with a permanent dipole moment.
    • Hydrogen bonds form between δ⁺ hydrogen of one water molecule and δ⁻ oxygen of another.
    • Although weak individually (~5–30 kJ/mol), in aggregate they form a strong network stabilizing water’s structure.
    • The polar nature explains water’s solvent capacity, high surface tension, and higher boiling/melting points compared to similar-sized molecules.
    • The constant breaking and reforming of hydrogen bonds gives water fluidity while maintaining cohesion.
    • Without polarity, water would behave more like hydrogen sulfide (Hβ‚‚S), a gas at room temperature β€” unsuitable for life.

    🧠 Examiner Tip: Always show δ⁺/δ⁻ in diagrams, use dotted lines for hydrogen bonds, and explicitly state that hydrogen bonds are intermolecular forces, not covalent bonds.

    • DNA: Hydrogen bonds between bases stabilize the double helix; 2 bonds between A–T and 3 between G–C make DNA both stable and flexible enough for replication.
    • Proteins: Secondary structures (Ξ±-helices, Ξ²-sheets) rely on intramolecular hydrogen bonds; tertiary structure is stabilized by hydrogen bonding between R-groups.
    • Carbohydrates: Cellulose fibers gain tensile strength from hydrogen bonds between chains, allowing plants to stand upright.
    • Structural proteins: Collagen’s triple helix is stabilized by hydrogen bonds, giving connective tissue tensile strength.
    • Enzymes: Substrate binding and enzyme–substrate complexes are stabilized by hydrogen bonds, essential for catalysis.
    • RNA: Hydrogen bonds mediate codon–anticodon pairing between mRNA and tRNA during translation, ensuring accurate protein synthesis.
    • Membranes: Polar phosphate heads of phospholipids form hydrogen bonds with water, stabilizing bilayers and maintaining cell integrity.
    • Polysaccharides and glycoproteins: Hydrogen bonding ensures solubility and recognition in cell–cell communication.

    🧬 IA Tips & Guidance: Experiments on enzyme activity, DNA denaturation, or protein folding can highlight hydrogen bonding. For example, varying pH or temperature shows how disruption of hydrogen bonds alters structure and function. Always link results back to the molecular basis: breaking hydrogen bonds destabilizes biological structures.

    • Water’s polarity allows it to dissolve ionic compounds (NaCl dissociates into Na⁺ and Cl⁻) and polar molecules like glucose.
    • This property underpins the transport of nutrients and wastes in blood plasma, plant sap, and cytoplasm.
    • Nonpolar molecules (lipids, fats) do not dissolve; instead, hydrophobic clustering occurs, driving membrane and protein folding.
    • Amphipathic molecules like phospholipids self-assemble into bilayers due to hydrophobic interactions, essential for membranes.
    • Enzymatic reactions occur in aqueous environments where substrates and enzymes can collide freely.
    • Water stabilizes enzyme conformation by forming hydration shells around charged residues.
    • Oxygen has low solubility in water, especially at 37Β°C; hemoglobin overcomes this limitation in blood.
    • Without water’s solvent properties, metabolism would not occur, and life could not persist.

    🌐 EE Focus: Extended essays could explore solubility of different biomolecules, enzyme kinetics in aqueous vs non-aqueous solutions, or hydrogen bonding in protein folding. Strong research connects molecular polarity to biological function.
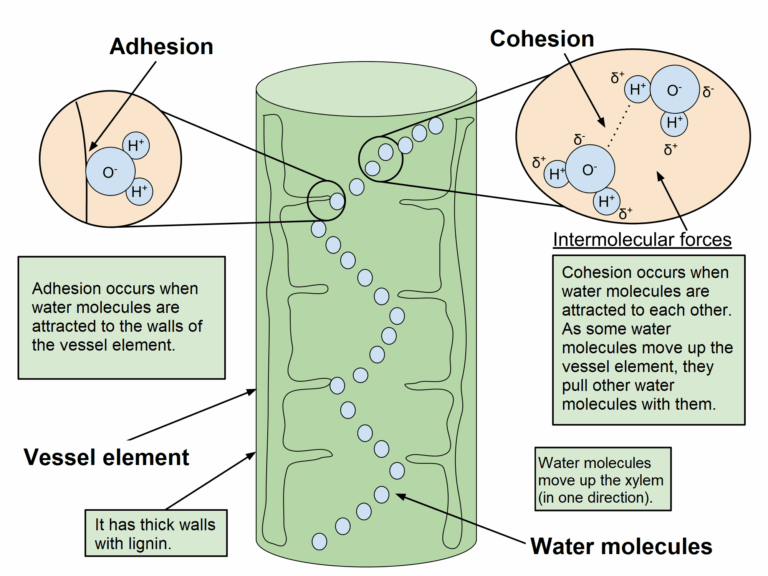
    • Cohesion: Hydrogen bonds cause water molecules to stick together, enabling continuous water columns in xylem.
    • Cohesion underlies the cohesion–tension mechanism, explaining how water moves against gravity during transpiration.
    • Adhesion: Water molecules form hydrogen bonds with cellulose in xylem walls, supporting capillary action.
    • This adhesion prevents water columns from collapsing under tension.
    • The combined effect of cohesion and adhesion maintains transpiration pull, vital for water and mineral transport in tall plants.
    • Surface tension, also a product of cohesion, allows small organisms like pond skaters to move across water surfaces.
    • Capillary action in soils also depends on adhesion, enabling plants to draw water from small pores.
    • These forces are essential for terrestrial plant survival and global water cycling.

    ❀️ CAS Link: Students could build simple capillary tube models or hydroponic systems to demonstrate cohesion and adhesion, linking IB biology to sustainable farming or community awareness projects.

    • Water has an unusually high specific heat capacity (4.2 J/gΒ°C), buffering organisms against rapid temperature change.
    • Aquatic habitats remain thermally stable, supporting biodiversity.
    • High latent heat of vaporization makes evaporation an efficient cooling mechanism (sweating, transpiration).
    • Ice is less dense than liquid water due to hydrogen bond lattice β†’ floats and insulates aquatic life below.
    • Hydrogen bonds require significant energy input to break, so water remains liquid across a wide temperature range.
    • Oceans act as heat sinks, moderating global climate by absorbing and redistributing heat.
    • Within organisms, thermal buffering maintains enzyme activity at near-optimal conditions.
    • Hydrogen bonding makes water a uniquely stable medium compared to other solvents.

    🌍 Real-World Connection: Global climate stability, human thermoregulation, polar ecosystems, and even weather systems all depend on hydrogen bonding in water.

    • Early Earth’s oceans, possibly near hydrothermal vents, provided an aqueous medium for prebiotic chemistry.
    • Water dissolved molecules and allowed collisions β†’ promoted synthesis of organic compounds.
    • Encapsulation of solutes in primitive membranes within water led to protocells.
    • Hydrogen bonding stabilized macromolecules like RNA and proteins, enabling catalysis.
    • Water continues to support life as the solvent of metabolism, a participant in hydrolysis and condensation, and the medium of transport.
    • Processes like respiration, photosynthesis, and digestion all require water.
    • Search for extraterrestrial life focuses on finding liquid water, as it remains the best indicator of habitability.
    • Without hydrogen bonding, water would lack the properties that made life’s origin possible.

    πŸ” TOK Perspective: Hydrogen bonding cannot be directly observed but is inferred from indirect evidence (boiling point anomalies, solubility, structural stability). This raises questions about how reliable indirect evidence is in building scientific knowledge. TOK reflection could explore: Is the presence of water sufficient evidence for life, or must we distinguish between necessary and sufficient conditions for life’s existence?

    πŸ“ Paper 2: In Paper 2, water questions usually test how hydrogen bonding links to function. You may be asked to draw hydrogen bonds, explain polarity and dipoles, or apply hydrogen bonding to properties like cohesion, solvent capacity, and thermal stability. Examiners also connect this to DNA base pairing, protein structure, or enzyme activity. Data questions often involve interpreting solubility or enzyme activity graphs, so always link anomalies back to hydrogen bonding and use precise terms like polar, dipole, and intermolecular force for full marks.

  • A model that illustrates how income and output circulate between different sectors of the economy, showing the continuous movement of money, resources, and goods/services. Money earned by households flows to firms when they spend it on goods and services, and flows back as income when firms pay for labor and resources. So, what do you think happens if households stop spending and start saving all their income? To answer this you need to understand the circular flow of income!

    1. Households provide factors of production (land, labor, capital, entrepreneurship) to firms.
    2. Firms pay households income (wages, rent, interest, profit).
    3. Households use this income to purchase goods and services from firms
    4. This creates a cycle of economic activity.

    For example a small town has a cafΓ© called Brew & Bite, and it interacts with households, the government, banks, and international trade. Sarah, a local resident, works as a barista at Brew & Bite who pays a wage for her labour. This is income to the household. Sarah uses part of her wage to buy coffee and snacks at Brew & Bite which is spending (consumption). This shows how money flows from the firm to the household and then back to the firm.

    Additionally, Brew & Bite earns revenue from customers like Sarah. It uses this money pay wages to staff, buy coffee beans and pastries from suppliers and pay rent and electricity bills. This shows how firms use income to pay for factors of production.

    ❀️ CAS Link: Record short interviews with people who represent different parts of the model like wage workers, entrepreneurs, tax collectors, bankers. Then, reflect on how they each experience the flow of income.

    Leakages

    Leakages are withdrawals of money from the circular flow of income, reducing the total amount of spending in the economy.

    SavingsMoney that households or businesses choose not to spend on goods and services, instead putting it into banks or other financial institutions. Moving back to the previous example if Sarah saves part of her salary in a bank account. It would be a leakage because it is withheld from the circular flow, meaning it’s not going to businesses so the flow of money between households and firms slows down, which can reduce income, production, and employment.

    🌍 Real-World Connection: For decades, Japanese households had one of the highest savings rates in the world, peaking at around 23% in the 1970s–1980s. However, excessive savings can slow down demand and lead to stagnation, as seen in Japan’s “Lost Decade”.

    Imports: Spending on foreign-produced goods and services. Money leaves the domestic economy to pay for these goods. Going back to my previous example, Brew & Bite imports specialty coffee beans from Colombia. This is a leakage because money leaves the local economy.

    🌍 Real-World Connection: In 2024, U.S. imports totaled $4.110 trillion, including $606 billion from the EU. Here, imports are a leakage because when U.S. households and businesses buy foreign goods, like French wine, German cars, or Italian fashion, that money leaves the U.S. economy and goes to producers abroad. Thus, this money leaves the domestic economy and reduces the total spending in the economy.

    Taxes: Money collected by the government from individuals and businesses in the form of income tax, corporate tax, VAT, etc. For example, if Brew & Bite pays business taxes to the government then that would be a leakage.

    🌍 Real-World Connection: In FY 2024 – 2025, India collected 12,90,144 crores in personal income tax. This is a leakage as money is withdrawn from the flow between households and firms.

    Injections

    Injections are additions of money into the circular flow, increasing the total level of spending in the economy.

    Investment: Spending by businesses on capital goods like machinery, buildings, and technology. Brew & Bite also takes a loan from the bank to renovate the shop. This is an example of investment because the cafΓ© is spending money on capital improvements that will increase its production capacity and improve efficiency. This spending creates new income for construction workers, suppliers, and equipment providers, keeping money moving through the economy. Thus, it is an injection into the circular flow of income because it adds new spending beyond just consumption.

    🌍 Real-World Connection: Warren Buffett, through Berkshire Hathaway, invested heavily in Apple Inc. He bought shares over several years starting in 2016. As of now, this investment is worth tens of billions of dollars, making Apple the largest holding in Berkshire’s portfolio. Apple uses this money to expand operations, hire workers, and develop products. This leads to higher employment and more income for households.

    Government spending: Expenditures by the government on goods and services such as infrastructure, healthcare, and education. For example, the government using tax revenue to subsidize local businesses and build better roads near Brew & Bites will be an injection because these government actions create income for construction workers, suppliers, and other firms involved in the projects, further circulating money through the economy.

    🌍 Real-World Connection: The UAE government spends AED 2.4 billion (3.8 per cent of the total general budget) in infrastructure and economic resources. This spending creates jobs for engineers, construction workers, and suppliers, pays businesses that provide materials, equipment, and services and leads to increased household income, which leads to more consumer spending. As a result, more money flows between households, firms, and the government. Thus, accelerating the circular flow of income.

    Exports: Goods and services produced domestically and sold to foreign consumers. This brings money into the domestic economy. Brew & Bite also sells locally made coffee mugs online to customers abroad. This is an injection because foreign customers pay in foreign currency, which gets converted to local income, bringing new money into the domestic economy.

    🌍 Real-World Connection: Indian tech firms Infosys, TCS, and Wipro provide software and consulting to foreign clients. When these foreign clients pay in U.S. dollars or euros, Indian companies receive foreign currency, which is converted into rupees, adding new money into India’s economy.

    • Only Two Sectors: households and firms (no government or foreign trade). Households provide factors of production (land, labour, capital, enterprise), and firms produce goods and services and pay households factor incomes (wages, rent, interest, profit). For example, the foreign sector which includes exports and imports is not included. In the real world, economies have governments (taxation, spending, regulations) and foreign sectors (exports/imports). Modern economies are interdependent, involving trade, financial markets, public services, and more. People these days don’t just work and spend. They save, invest and pay taxes which this model excludes. Have you made any recent investments lately in crypto or elsewhere?
    • No Government Intervention: no taxes or government spending and no public sector influence on the economy. However in the real world governments play a crucial role. They regulate industries and provide public goods. For example, in the early 2000s, the U.S. financial sector operated with minimal government oversight. Banks and mortgage lenders engaged in high-risk lending, giving loans to people who couldn’t afford them (subprime mortgages). The government failed to regulate these risky financial instruments (like mortgage-backed securities and derivatives). There were no checks on how much risk banks could take, and financial markets became overleveraged. Ratings agencies also went unregulated, giving AAA ratings to risky assets. As a result, when homeowners defaulted on their loans, the financial system began to collapse. Major banks and firms (like Lehman Brothers) failed, and a global credit crisis followed. Thus, During the 2008 financial crisis, the U.S. government and Federal Reserve intervened with bailouts for major banks, AIG, and auto companies, emergency interest rate cuts, stimulus packages to revive the economy, and introduced the Dodd-Frank Act (2010) to increase financial sector oversight and prevent future crises. Without government intervention, there’s no way to address market failures like poverty, pollution, or monopolies.
    • No Foreign Sector: no imports or exports, and all goods and services are produced and consumed domestically. Whereas in reality, countries rely on trade for resources they don’t have (e.g., oil, tech, food). For example, India imports oil from Russia for most of the transportation system to work.
    • All Incomes Are Spent (No Savings): households spend all their income on consumption. In reality, households save a portion of their income for retirement, education, and emergencies or future purchases. Did you know Indian households are among the largest savers of gold in the world? Indian families hold an estimated over 25,000 tonnes of gold, more than the reserves of most central banks. Rather than spending all income on goods and services, many Indian households convert a portion of their earnings into physical gold, treating it as a form of savings or investment. Thus, not all income is spent.

    It is when total leakages = total injections.

    🌐 EE Focus: Research question ideas: – To what extent has government fiscal policy (taxation and spending) influenced the circular flow of income in [your country/city] during the COVID-19 pandemic?
    – To what extent has a persistent trade deficit affected the circular flow of income in [country]?
    – How has the change in household savings rates affected investment and income growth in [country] between 2020 and 2025?

    In a perfectly balanced or ideal economic scenario, leakages and injections would be equal, leading to a state of equilibrium in the circular flow of income. However, in the real world this perfect balance is rarely maintained due to a variety of constantly changing economic conditions because:

    1. Households may save more than businesses invest. For example, Indian households often prefer saving in physical gold rather than depositing money in banks or investing in financial markets. Unlike savings deposited in banks (which can be lent to firms for investment), gold savings are idle. This acts as a leakage, reducing consumption demand, funds available for business investment and overall economic activity.
    2. When savings > investment, this creates a leakage larger than the injection, leading to a fall in national income. For example, during the covid era, households started saving more than investing which led to a fall in the national income of a lot of countries such as China and India. India’s household financial savings rose to 21% of GDP in Q1 2020–21, up from 7.9% in the previous year.
    3. Governments often spend more than they collect in taxes (budget deficits), or sometimes less (surpluses). For example, in 2023, the U.S. federal government ran a budget deficit of $1.7 trillion, meaning government spending exceeded tax revenue by that amount. These deficits often occur due to increased spending on programs like Social Security, defense, and healthcare.
    4. Many economies consistently run trade deficits.

    ❀️ CAS Link: Create an Educational Video or Animation. The goal is to explain the circular flow of income in a fun and simplified way to GCSE and MYP students. This could include graphics, voice-over, and real-life examples (e.g., local businesses). CAS Learning Outcomes: Demonstrate the skills and recognize the benefits of working collaboratively.

    Helps governments manage budgets and plan spending. When national income is stable, governments can accurately forecast tax revenues, which helps them plan public spending effectively and avoid unexpected deficits. For example, in the UK the government was able to allocate over Β£180 billion to the NHS and increase investments in transport and green energy.

    When leakages = injections, national income remains stable. For example, if households save β‚Ή100 crores and firms invest β‚Ή100 crores, the leakage (savings) is matched by the injection (investment). This balance prevents sudden changes in GDP or unemployment.

    Avoids unwanted inflation or deflation. Inflation occurs when demand for goods and services exceeds supply. If national income rises too quickly (too much money in people’s hands), people spend more, but if production doesn’t keep up, prices rise. Whereas deflation happens when income falls, reducing demand. This means lower spending forces businesses to cut prices, reduce wages, or even shut down, creating a downward spiral. For example, During the Great Depression, falling incomes caused people to stop spending. This led to deflation and mass unemployment. If income had remained stable, demand would have continued, helping the economy recover sooner. Thus, stable national income keeps demand and supply in sync, which prevents too much demand (inflation) and too little demand (deflation).

    Stable income levels encourage predictable spending and investment. A salaried family confidently takes a home loan due to consistent income. Whereas, if there is a sudden change in income for example one person earning money got a long term sickness then the whole family’s spending pattern will have to change instantly and decrease. This leads to less money circulating in the economy.

    Stable output and income mean steady tax revenue. When an economy produces consistently (stable output) and households/businesses earn steady incomes, the government collects reliable tax revenue from income tax, corporate tax, and consumption taxes like VAT or GST. This steadiness helps governments fund public services and allocate funds for the future.

    1. If leakages (like high savings or taxes) exceed injections, demand falls so businesses cut output which leads to job losses. For example, during the 2008 financial crisis, many households in countries like the United States and Europe increased their savings and reduced spending due to economic uncertainty and job fears. At the same time, governments raised taxes or cut spending in some regions to manage deficits. As a result, consumer demand fell sharply. Businesses faced declining sales, so they cut production and laid off workers. This led to high unemployment rates. The fall in demand and job losses further deepened the recession.
    2. If injections (like heavy government spending or booming exports) exceed leakages, demand can exceed supply. As a result, inflationary pressures build up, leading to a general rise in the price level. In the long term, this will reduce real purchasing power, increased production costs and increased interest rates.
    3. A surplus of imports over exports drains money from the domestic economy (net leakage), leading to long-term current account deficits. For example, the United States has consistently experienced a trade deficit, where imports exceed exports by a large margin. For instance, in 2023, the U.S. trade deficit was over $773 billion.
    4. Disequilibrium causes uncertainty so businesses delay investment, and consumers reduce spending. For example, following the 2016 Brexit referendum, the UK faced significant economic disequilibrium and uncertainty about its future trade relations and regulations. As a result, many businesses delayed or scaled back investment due to unclear rules on tariffs, customs, and market access.

    πŸ” TOK Perspective: “ToΒ whatΒ extentΒ canΒ economicΒ modelsΒ likeΒ theΒ circularΒ flowΒ accuratelyΒ reflectΒ real-worldΒ complexity?” This model is a simplification which helps us understand the economy however human behaviour is not always rational or predictable, and the model assumes constantΒ flowsΒ (noΒ delays,Β uncertainty). Additionally, it doesn’t show inequality or informal sectors.

    Households

    • Supply factors of production: labor, land, capital, enterprise
    • Receive income through wages, rent, interest, profit
    • Use this income to buy goods and services
    • Income gives them purchasing power and access to goods/services.
    • LeakagesΒ likeΒ taxesΒ andΒ savingsΒ reduceΒ disposableΒ income.

    While households supply factors of production and drive demand through consumption, their ability to spend is limited by disposable income, which can be reduced by taxes and savings. For example, during economic uncertainty, households may increase savings and reduce spending, causing reduced consumption levels that slow down economic growth and activity.

    Firms

    • Hire factors of production from households
    • Sell goods and services to households and other sectors
    • Invest in capital (injections) and generate profits
    • Consumer spending provides revenue and profit.
    • GovernmentΒ spendingΒ andΒ exportsΒ alsoΒ supportΒ businessΒ growth.

    Firms rely on consumer spending and government support to generate revenue and invest. However, investment decisions are highly sensitive to economic confidence and interest rates. In downturns, firms may cut back on investment and employment, increasing recessions despite government efforts to stimulate growth.

    Government

    • Collects taxes from households and firms (leakages)
    • Spends on public goods, services, and welfare (injections)
    • Must manage the balance between taxation (leakages) and spending (injections).
    • HelpsΒ stabilizeΒ theΒ economyΒ duringΒ boomsΒ andΒ recessions.

    While governments can lead increase consumption levels through spending and investment. It could also lead to budget deficits in the long run which can negatively affect the standards of living and economic output in the long run however this depends on how much is the budget deficit.

  • TermDefinition
    In-situ ConservationProtecting species in their natural habitat.
    Ex-situ ConservationConserving species outside their natural habitat, such as in zoos or botanical gardens.
    Protected AreaA designated region managed to conserve biodiversity and natural resources.
    Restoration EcologyThe process of assisting the recovery of degraded ecosystems.
    Sustainable UseUsing biological resources in a way that does not lead to long-term decline.

    Conservation strategies aim to protect biodiversity, maintain ecosystem services, and ensure the sustainable use of natural resources. These strategies operate at global, national, and local levels, and include both proactive measures to prevent biodiversity loss and reactive measures to restore degraded ecosystems. Effective conservation requires a combination of in-situ and ex-situ methods, legal protection, community involvement, and integration with sustainable development goals.

    • Establishment of national parks, wildlife reserves, and marine protected areas.
    • Legal enforcement against poaching, logging, and illegal fishing.
    • Habitat restoration to support natural populations.
    • Community-based conservation projects involving local stakeholders.
    • Ecological corridors to connect fragmented habitats.
    • Control of invasive species within protected areas.

    🧠 Examiner Tip: Always highlight that in-situ conservation maintains natural ecological processes and species interactions.

    • Zoos and aquaria for captive breeding and reintroduction programmes.
    • Botanical gardens and seed banks preserving plant genetic diversity.
    • Cryopreservation of gametes and embryos for rare species.
    • Gene banks for agricultural crops and livestock.
    • Rescue and rehabilitation centres for injured wildlife.
    • Ensures survival when in-situ conservation is not possible.

    🧬 IA Tips & Guidance: An IA could assess germination rates of seeds stored under different conditions to model seed bank viability.

    • National biodiversity strategies aligned with the Convention on Biological Diversity (CBD).
    • Endangered Species Acts and wildlife protection laws.
    • CITES regulating international trade in endangered species.
    • Environmental impact assessments before development projects.
    • Integration of biodiversity conservation into land-use planning.
    • Enforcement mechanisms and penalties for violations.

    🌐 EE Focus: An EE could compare the effectiveness of protected areas in two different countries or ecosystems.

    • Reforestation and afforestation projects.
    • Wetland restoration to improve water quality and biodiversity.
    • Sustainable forestry and fisheries management practices.
    • Agroforestry combining agriculture with biodiversity benefits.
    • Ecotourism generating revenue while conserving habitats.
    • Payment for ecosystem services to incentivise conservation.

    ❀️ CAS Link: A CAS project could involve volunteering in a local habitat restoration programme or running a biodiversity awareness campaign.

    • Indigenous knowledge integrated into conservation planning.
    • Local communities trained as wildlife monitors or eco-guides.
    • Cross-border conservation initiatives for migratory species.
    • Partnerships between governments, NGOs, and private sector.
    • Public awareness campaigns and environmental education.
    • Citizen science projects for biodiversity monitoring.

    πŸ” TOK Perspective: Conservation decisions often involve balancing scientific recommendations with cultural, economic, and political considerations.

    🌍 Real-World Connection:
    Successful conservation strategies can restore endangered species populations, revitalise ecosystems, and support sustainable livelihoods.

    πŸ“ Paper 2:
    Be prepared to compare in-situ and ex-situ methods, give examples of conservation strategies, and evaluate their effectiveness.

  • TermDefinition
    Habitat LossThe destruction, fragmentation, or degradation of natural habitats, reducing their ability to support species.
    OverexploitationThe unsustainable harvesting of species for food, trade, or other purposes.
    Invasive SpeciesNon-native species that outcompete, prey on, or otherwise harm native species and ecosystems.
    PollutionThe introduction of harmful substances or energy into the environment, adversely affecting biodiversity.
    Climate ChangeLong-term alteration of global or regional climate patterns, impacting ecosystems and species survival.

    Biodiversity faces unprecedented threats from human activities, leading to what many scientists call the sixth mass extinction. These threats operate at multiple scales β€” from local habitat destruction to global climate change β€” and often act synergistically, accelerating biodiversity loss. Understanding these threats is essential for developing effective conservation strategies and policies to protect life on Earth.

    • Caused by agriculture, urbanisation, mining, and infrastructure development.
    • Leads to smaller, isolated populations more vulnerable to extinction.
    • Reduces available food, shelter, and breeding sites.
    • Alters ecological processes such as pollination and nutrient cycling.
    • Creates edge effects that change microclimates and species interactions.
    • Particularly devastating for species with large home ranges or specialised habitats.

    🧠 Examiner Tip: Always specify the driver behind habitat loss in examples β€” e.g., deforestation for soybean farming in the Amazon.

    • Includes overfishing, overhunting, and overharvesting of plants.
    • Depletes populations faster than they can reproduce.
    • Can cause collapse of fisheries and wildlife populations.
    • Often driven by high market demand and illegal trade.
    • Selective harvesting can alter genetic diversity.
    • Example: overharvesting of medicinal plants leading to extinction risk.

    🧬 IA Tips & Guidance: An IA could assess the impact of human harvesting on population sizes of a local plant or animal species.

    • Outcompete native species for resources.
    • May introduce diseases to which natives have no immunity.
    • Can alter ecosystem structure and function.
    • Often spread through global trade and travel.
    • Particularly harmful to island ecosystems.
    • Example: introduction of brown tree snakes to Guam leading to bird extinctions.

    🌐 EE Focus: An EE could investigate the ecological and economic impacts of a specific invasive species in a local area.

    • Chemical: pesticides, heavy metals, and industrial waste harming organisms directly.
    • Plastic: ingestion and entanglement affecting marine life.
    • Nutrient: fertiliser runoff causing eutrophication and dead zones.
    • Light and noise: disrupting animal behaviours such as migration and reproduction.
    • Pollution can act synergistically with other threats.
    • Persistent pollutants can bioaccumulate in food chains.

    ❀️ CAS Link: A CAS project could involve organising a community clean-up and awareness campaign on pollution impacts on biodiversity.

    • Alters temperature and precipitation patterns.
    • Shifts species ranges and disrupts migration timing.
    • Causes coral bleaching and loss of polar ice habitats.
    • Increases frequency of extreme weather events.
    • Forces rapid adaptation or migration, which many species cannot achieve.
    • Contributes to ocean acidification, harming marine biodiversity.

    πŸ” TOK Perspective: Decisions on prioritising biodiversity threats involve value judgments, as resources are limited and trade-offs must be made between economic and environmental goals.

    🌍 Real-World Connection:
    Biodiversity loss threatens food security, ecosystem services, and global economies, making it both an environmental and socio-economic crisis.

    πŸ“ Paper 2:
    Expect to discuss major threats to biodiversity, give examples, and explain how these threats interact to accelerate species loss.

  • TermDefinition
    BiodiversityThe variety of life in all its forms, levels, and combinations, including genetic, species, and ecosystem diversity.
    Genetic DiversityThe variation of genes within a species, providing the raw material for adaptation and evolution.
    Species DiversityThe number of different species and their relative abundance in an area.
    Ecosystem DiversityThe variety of ecosystems and ecological processes within the biosphere.
    Endemic SpeciesSpecies found only in a specific geographic location.

    Biodiversity is the foundation of ecosystem stability, resilience, and productivity. It is essential for maintaining ecological balance and supporting human well-being through ecosystem services such as food production, water purification, climate regulation, and cultural enrichment. Biodiversity exists at multiple levels β€” from genetic diversity within species to the variety of ecosystems across landscapes β€” and is the result of millions of years of evolutionary processes. Its preservation is vital for sustaining life on Earth and adapting to environmental changes.

    • Genetic diversity ensures populations can adapt to changing environments.
    • Species diversity maintains ecosystem balance and resilience.
    • Ecosystem diversity supports a wide range of ecological processes.
    • All levels are interconnected and influence each other.
    • Loss at one level often impacts the others.
    • Measurement uses indices such as Shannon-Wiener or Simpson’s index.

    🧠 Examiner Tip: When describing biodiversity, always specify the level (genetic, species, or ecosystem) and give an example.

    • Enhances ecosystem productivity through niche differentiation.
    • Increases stability against environmental fluctuations.
    • Supports nutrient cycling and energy flow.
    • Provides habitat for a variety of organisms.
    • Ensures pollination and seed dispersal.
    • Promotes resilience to invasive species and disease outbreaks.

    🧬 IA Tips & Guidance: An IA could investigate species diversity in different habitats using a quadrat or transect sampling method.

    • Provisioning services: food, water, raw materials, medicines.
    • Regulating services: climate regulation, flood control, disease regulation.
    • Cultural services: recreation, spiritual value, education.
    • Supporting services: soil formation, primary production.
    • Acts as a genetic resource for crop and livestock improvement.
    • Provides economic benefits through tourism and ecosystem products.

    🌐 EE Focus: An EE could explore the relationship between biodiversity and crop productivity, analysing how species richness affects yields.

    • Healthy ecosystems usually have high biodiversity.
    • Sudden biodiversity loss signals environmental degradation.
    • Bioindicator species can signal changes in ecosystem quality.
    • Monitoring biodiversity helps track climate change impacts.
    • Protecting biodiversity protects ecosystem services.
    • Restoration ecology aims to recover biodiversity in degraded areas.

    ❀️ CAS Link: A CAS project could involve organising a biodiversity survey in a local park and presenting results to raise community awareness.

    • Biodiversity is highest in tropical regions and decreases toward the poles.
    • Hotspots are regions with high species richness and high threat levels.
    • Island ecosystems often have high endemism but are vulnerable to disturbances.
    • Mountain regions offer diverse microhabitats increasing species diversity.
    • Marine biodiversity is concentrated in coral reefs and coastal zones.
    • Climate, geography, and evolutionary history shape biodiversity patterns.

    πŸ” TOK Perspective: Biodiversity valuation involves subjective decisions about which species and ecosystems are most important, reflecting human perspectives and cultural values.

    🌍 Real-World Connection:
    Biodiversity underpins global food security, climate stability, and sustainable economic growth, making its protection critical for long-term human survival.

    πŸ“ Paper 2:
    Be ready to define biodiversity at different levels, explain its importance to ecosystems and humans, and give examples of biodiversity hotspots.

  • TermDefinition
    Adaptive RadiationThe rapid diversification of a single ancestral species into multiple new species, each adapted to a specific ecological niche.
    PolyploidyThe condition in which an organism has more than two complete sets of chromosomes, common in plant speciation.
    AutopolyploidyPolyploidy arising from chromosome duplication within a single species.
    AllopolyploidyPolyploidy resulting from hybridisation between different species followed by chromosome doubling.
    Niche DifferentiationThe process by which competing species use the environment differently to coexist.

    Adaptive radiation is a process where an ancestral species rapidly diversifies into multiple species adapted to different ecological niches. In plants, speciation is often influenced by polyploidy, hybridisation, and environmental variation. Plant adaptive radiation is especially common on islands, in isolated habitats, or following environmental change. The flexibility of plant reproductive systems and their ability to undergo genome duplication allow for rapid formation of reproductively isolated lineages.

    • Begins with a single ancestral species colonising new or underused environments.
    • Rapid speciation driven by ecological opportunities.
    • Morphological and physiological adaptations evolve for specific niches.
    • Reduced competition in newly colonised areas accelerates diversification.
    • Can occur after mass extinctions or environmental shifts.
    • Results in high biodiversity in a relatively short evolutionary period.

    🧠 Examiner Tip: When giving examples of adaptive radiation, always link species’ adaptations to the ecological niches they occupy.

    • Common in plants but rare in animals.
    • Autopolyploidy results from nondisjunction during meiosis, producing unreduced gametes.
    • Allopolyploidy combines chromosome sets from different species.
    • Polyploid plants are often reproductively isolated from diploid relatives.
    • Can lead to immediate speciation in a single generation.
    • Examples: bread wheat (Triticum aestivum), cotton, tobacco.

    🧬 IA Tips & Guidance: An IA could compare chromosome numbers in related plant species to investigate possible polyploid origins.

    • Island ecosystems promote rapid radiation due to isolation and diverse habitats.
    • Mountain ranges create microhabitats and climatic gradients.
    • Human-altered landscapes can generate novel niches.
    • Pollinator specialisation drives floral diversification.
    • Seasonal and climatic variation influences reproductive timing.
    • Soil type and nutrient availability affect plant morphology and physiology.

    🌐 EE Focus: An EE could explore the role of pollinator diversity in driving adaptive radiation in flowering plants.

    • Hawaiian silverswords: radiated from a single ancestor into diverse forms adapted to different altitudes and habitats.
    • GalΓ‘pagos Scalesia: tree-like daisies adapting to varied island conditions.
    • African violets: diversified in mountain forests with distinct niches.
    • Wild sunflowers: adapted to different soil types and moisture levels.
    • Brassica crops: artificial selection mimicking natural adaptive diversification.
    • Orchid family: extreme floral diversity linked to specialised pollinators.

    ❀️ CAS Link: A CAS activity could involve planting and observing species adapted to different microhabitats in a school garden to illustrate adaptive variation.

    • Hybridisation without chromosome doubling can still produce new species.
    • Ecological isolation via adaptation to distinct microhabitats.
    • Temporal isolation due to differences in flowering periods.
    • Gametic incompatibility between pollen and stigma.
    • Chromosomal rearrangements reducing fertility with parent species.
    • Reinforcement of barriers through selection against hybrids.

    πŸ” TOK Perspective: Plant speciation challenges the idea that species boundaries are fixed β€” polyploidy can create new species almost instantly, showing how rapid evolutionary change is possible.

    🌍 Real-World Connection:
    Understanding adaptive radiation and plant speciation helps in agriculture (developing new crop varieties), conservation (protecting rare endemic plants), and habitat restoration.

    πŸ“ Paper 2:
    Expect questions asking you to explain polyploidy, give plant examples of adaptive radiation, and relate environmental factors to speciation rates.

  • TermDefinition
    SpeciationThe process by which new species arise from existing ones.
    Allopatric SpeciationSpeciation due to geographical isolation between populations.
    Sympatric SpeciationSpeciation occurring within the same geographical area, often due to ecological or behavioural isolation.
    Reproductive IsolationBarriers preventing gene flow between populations, leading to speciation.
    Hybrid ZoneRegion where two species meet and interbreed, producing hybrids.

    Speciation is the formation of new species through the gradual accumulation of genetic differences that prevent interbreeding. This process is driven by reproductive isolation, which can be caused by geographic separation, ecological divergence, behavioural differences, or genetic incompatibility. Understanding isolation mechanisms is crucial for explaining biodiversity patterns and evolutionary processes.

    • Allopatric: Geographic barriers prevent gene flow, leading to divergence.
    • Peripatric: Small populations become isolated at the edge of a larger population’s range, allowing rapid divergence.
    • Parapatric: Adjacent populations diverge while maintaining some gene flow.
    • Sympatric: Occurs without physical barriers, often via polyploidy in plants or niche specialisation.
    • Speciation speed varies β€” can be gradual or rapid.
    • Molecular evidence helps confirm speciation events.

    🧠 Examiner Tip: Always link examples of speciation to the type β€” e.g., Darwin’s finches (allopatric), cichlid fish in the same lake (sympatric).

    • Temporal isolation: species breed at different times/seasons.
    • Behavioural isolation: unique courtship behaviours prevent interbreeding.
    • Mechanical isolation: incompatible reproductive structures.
    • Ecological isolation: different habitats reduce encounters.
    • Gametic isolation: gametes cannot fuse due to chemical incompatibility.
    • Prezygotic barriers prevent fertilisation entirely.

    🧬 IA Tips & Guidance: A possible IA could investigate mating behaviours in a model organism to study behavioural isolation patterns.

    • Hybrid inviability: hybrids fail to develop or survive.
    • Hybrid sterility: hybrids survive but cannot reproduce (e.g., mule).
    • Hybrid breakdown: hybrid offspring viable but less fit or fertile in subsequent generations.
    • Postzygotic barriers reinforce species boundaries.
    • Often result from genetic incompatibilities.
    • Maintain separation even when hybridisation occurs.

    🌐 EE Focus: An EE could analyse genetic incompatibilities causing hybrid sterility in closely related species.

    • Natural selection drives adaptation to different environments, reinforcing isolation.
    • Genetic drift can fix differences in small populations.
    • Founder effects accelerate divergence in isolated groups.
    • Sexual selection may lead to reproductive isolation through mate preferences.
    • Isolation allows accumulation of unique alleles.
    • Gene flow reduction is key to speciation.

    ❀️ CAS Link: A CAS project could involve presenting case studies of local species undergoing isolation to a school science club.

    • Darwin’s finches (allopatric, adaptive radiation).
    • Apple maggot flies shifting from hawthorn to apple trees (sympatric).
    • Cichlid fishes in African lakes (sympatric).
    • Polar and grizzly bears producing hybrids yet remaining distinct species.
    • Plant polyploidy in wheat and other crops.
    • Squirrels separated by the Grand Canyon (allopatric).

    πŸ” TOK Perspective: Speciation illustrates how defining species is not always straightforward β€” the concept is shaped by the criteria scientists choose to emphasise (morphological, genetic, ecological).

    🌍 Real-World Connection:
    Understanding speciation helps in conservation by identifying evolutionarily significant units and preventing genetic homogenisation of populations.

    πŸ“ Paper 2:
    Expect to explain types of speciation, give examples, and distinguish between prezygotic and postzygotic isolation mechanisms.

  • TermDefinition
    EvolutionThe change in heritable characteristics of populations over successive generations.
    MicroevolutionSmall-scale evolutionary changes within a population over short timescales.
    MacroevolutionLarge-scale evolutionary changes that result in the formation of new species or higher taxa.
    Fossil RecordPreserved remains or traces of past organisms, providing evidence of evolutionary change.
    Homologous StructuresStructures with similar anatomy due to shared ancestry, even if function differs.

    Evolution explains the diversity of life by showing how species change over time through natural selection and other mechanisms. Evidence for evolution comes from multiple disciplines, including palaeontology, comparative anatomy, embryology, molecular biology, and biogeography. The integration of fossil evidence with genetic data has created a robust framework that connects extinct and extant species in a continuous evolutionary lineage.

    • Shows chronological changes in organisms through the geological record.
    • Transitional fossils bridge gaps between major groups (e.g., Archaeopteryx between reptiles and birds).
    • Radiometric dating provides accurate age estimates for fossils.
    • Fossil distribution aligns with evolutionary theory and plate tectonics.
    • Reveals extinct species and their relationship to modern organisms.
    • Helps calibrate molecular clocks for evolutionary timelines.

    🧠 Examiner Tip: When giving fossil examples, always link them to the evolutionary transition they represent.

    • Homologous structures indicate shared ancestry (e.g., vertebrate forelimbs).
    • Analogous structures arise from convergent evolution, not shared ancestry.
    • Vestigial structures are remnants of features from ancestors (e.g., human appendix).
    • Comparative embryology shows similar developmental stages among different species.
    • Morphological patterns can be mapped onto phylogenetic trees.
    • Anatomy supports hypotheses generated from molecular data.

    🧬 IA Tips & Guidance: An IA could compare morphological data from related species to test phylogenetic predictions.

    • DNA and protein sequence comparisons show degrees of relatedness.
    • Highly conserved genes (e.g., cytochrome c) provide deep evolutionary links.
    • Molecular clocks estimate divergence times.
    • Supports and refines phylogenetic trees built from morphology.
    • Can reveal cryptic species undetectable by anatomy alone.
    • Mitochondrial DNA useful for tracing maternal lineages.

    🌐 EE Focus: An EE could investigate the correlation between genetic similarity and geographical distribution of related species.

    • Species distribution patterns support continental drift and plate tectonics.
    • Endemic species on islands often resemble mainland relatives but are distinct.
    • Adaptive radiation seen in isolated habitats (e.g., Darwin’s finches).
    • Continental separation explains unique fauna in Australia.
    • Dispersal and vicariance shape species ranges.
    • Fossil distribution matches predicted historical land connections.

    ❀️ CAS Link: A CAS project could involve mapping local biodiversity and explaining its evolutionary significance to a community audience.

    • Antibiotic resistance in bacteria evolves rapidly under selection pressure.
    • Insecticide resistance in agricultural pests.
    • Industrial melanism in peppered moths as an example of natural selection.
    • Climate change affecting migration and breeding times in birds.
    • Laboratory experiments demonstrating artificial selection in plants/animals.
    • Rapid evolution in invasive species adapting to new environments.

    πŸ” TOK Perspective: The variety of evidence for evolution highlights the role of converging lines of inquiry in building strong scientific theories.

    🌍 Real-World Connection:
    Evolutionary evidence guides conservation strategies, helps predict disease emergence, and informs sustainable agriculture through understanding pest resistance.

    πŸ“ Paper 2:
    Be prepared to describe multiple lines of evidence for evolution, give examples, and explain how different data sources complement each other.

  • TermDefinition
    ReclassificationThe reassignment of organisms to different taxonomic groups based on new evidence.
    SystematicsThe scientific study of the diversity of organisms and their evolutionary relationships.
    Monophyletic GroupA group containing an ancestor and all its descendants.
    Polyphyletic GroupA group containing organisms from different ancestors, not including their most recent common ancestor.
    Paraphyletic GroupA group containing an ancestor and some, but not all, of its descendants.

    Reclassification is an essential part of taxonomy as scientific understanding evolves. As new evidence emerges β€” particularly from molecular genetics β€” organisms may be reassigned to more accurate groups. This process reflects the dynamic nature of systematics, which aims to represent evolutionary history as precisely as possible. Reclassification ensures that taxonomic systems remain consistent with current scientific knowledge, even if it means overturning long-held classifications.

    • Discovery of new fossil or living species.
    • Molecular evidence (DNA, RNA, protein sequences) revealing unexpected relationships.
    • Correction of historical misclassifications based on superficial similarities.
    • Evidence of convergent evolution misleading earlier classification.
    • Advances in bioinformatics allowing more robust phylogenetic analysis.
    • Refinement of evolutionary models to reflect new data.

    🧠 Examiner Tip: When discussing reclassification in IB answers, always give a concrete example, such as the reclassification of prokaryotes into separate domains: Bacteria and Archaea.

    • DNA sequencing can reveal genetic similarities and differences invisible to morphology.
    • Ribosomal RNA gene sequences are often used to determine deep evolutionary splits.
    • Mitochondrial DNA is used for recent divergence studies.
    • Molecular data can confirm or contradict morphology-based classifications.
    • Has led to major taxonomic revisions, such as splitting Protista into multiple lineages.
    • Supports the three-domain system over the traditional five-kingdom model.

    🧬 IA Tips & Guidance: A possible IA could analyse genetic sequence data from online databases to propose a reclassification of a selected group.

    • Prokaryotes: Once grouped as Monera, now divided into Bacteria and Archaea.
    • Fungi: Previously classified with plants, now recognised as a separate kingdom.
    • Whales: Once grouped separately, now classified with even-toed ungulates (Artiodactyla) based on molecular data.
    • Protists: Split into multiple eukaryotic supergroups based on genetic evidence.
    • Pandas: Giant pandas and red pandas once thought closely related, now placed in different families.
    • Birds: Reclassified as a subgroup of reptiles based on cladistic analysis.

    🌐 EE Focus: An EE could examine the role of molecular evidence in the reclassification of a specific taxonomic group, integrating both historical and modern perspectives.

    • Requires consensus among the scientific community.
    • Can cause confusion in literature and field guides.
    • Changes in names may affect conservation legislation and legal documents.
    • Requires updates to educational materials and databases.
    • Some classifications remain debated despite molecular evidence.
    • Historical inertia can slow adoption of new classifications.

    ❀️ CAS Link: A CAS project could involve updating a local biodiversity database to reflect recent taxonomic changes.

    • Integrates taxonomy, evolutionary biology, and molecular genetics.
    • Informs conservation priorities by identifying evolutionarily distinct species.
    • Supports ecological studies by clarifying species identities.
    • Assists in tracking the spread of invasive species.
    • Helps in drug discovery by identifying related species with known properties.
    • Contributes to understanding the tree of life.

    πŸ” TOK Perspective: Reclassification illustrates how scientific knowledge is provisional and subject to revision β€” even well-established systems can change when new evidence arises.

    🌍 Real-World Connection:
    Reclassification affects agriculture, conservation, and medicine β€” for example, correctly identifying pathogen species is crucial for disease control.

    πŸ“ Paper 2:
    Expect questions asking you to explain why reclassification occurs, give examples, and discuss how molecular evidence has reshaped taxonomy.

  • TermDefinition
    CladisticsA method of classification that groups organisms based on common ancestry and shared derived characteristics (synapomorphies).
    CladeA group of organisms consisting of a common ancestor and all its descendants.
    SynapomorphyA shared derived trait unique to a clade, indicating common ancestry.
    NodeA branching point on a cladogram representing the most recent common ancestor of the descendant lineages.
    OutgroupA species or group outside the clade being studied, used to infer ancestral traits.

    Cladistics is a classification approach that focuses on evolutionary relationships rather than overall similarity. It groups organisms into clades, each representing a single branch of the tree of life, defined by shared derived characteristics. Cladograms, the diagrams produced through cladistic analysis, visually represent hypotheses about evolutionary relationships. This method has transformed taxonomy, particularly with the integration of molecular data, making it possible to resolve relationships that morphology alone could not.

    • Groups are based solely on shared derived traits, not ancestral traits.
    • All members of a clade share a common ancestor.
    • Cladograms are constructed using both morphological and molecular data.
    • Branching order represents hypothesised evolutionary pathways.
    • Outgroups help determine which traits are ancestral vs derived.
    • Cladistics aims for monophyletic groups β€” including all descendants of a common ancestor.

    🧠 Examiner Tip: When drawing cladograms, label each branch with a shared derived characteristic; avoid mixing ancestral traits with synapomorphies.

    • Identify traits and determine which are ancestral vs derived.
    • Use an outgroup for reference.
    • Assign traits to different branches based on appearance in evolutionary history.
    • Arrange branches so that each node represents the emergence of a new trait.
    • Molecular data (DNA, RNA, protein sequences) can refine branch placement.
    • Branch length may or may not represent evolutionary time β€” check diagram details.

    🧬 IA Tips & Guidance: A possible IA could construct cladograms from genetic sequence data of related plant or animal species and compare them to morphology-based diagrams.

    • Reflects actual evolutionary history more accurately than traditional systems.
    • Allows integration of molecular evidence.
    • Avoids polyphyletic and paraphyletic groupings.
    • Highlights the evolutionary significance of traits.
    • Can be updated easily with new data.
    • Provides testable hypotheses about relationships.

    🌐 EE Focus: An EE could investigate whether morphological or molecular data produce more accurate cladograms for a specific taxonomic group.

    • Requires accurate identification of derived vs ancestral traits.
    • Convergent evolution can mislead trait-based analysis.
    • Incomplete fossil records may limit available data.
    • Different data sets (morphological vs molecular) can produce conflicting trees.
    • Rapid evolutionary change can obscure relationships.
    • Assumes traits evolve in a linear, non-reversible fashion (which may not be true).

    ❀️ CAS Link: A CAS project could involve teaching younger students how to read and construct cladograms through an interactive workshop.

    • Uses DNA, RNA, or protein sequence comparisons to identify similarities and differences.
    • Molecular clocks estimate divergence times between clades.
    • Ribosomal RNA sequences are often used due to their slow rate of change.
    • Mitochondrial DNA is useful for tracing maternal lineages.
    • Data analysis requires bioinformatics tools.
    • Can reveal cryptic evolutionary relationships invisible to morphological study.

    πŸ” TOK Perspective: Cladistics shows how scientific knowledge is shaped by the choice of evidence β€” morphological and molecular data may lead to different interpretations of evolutionary history.

    🌍 Real-World Connection:
    Cladistics is used in epidemiology to track virus evolution, in conservation biology to prioritise unique evolutionary lineages, and in agriculture to breed resistant crops.

    πŸ“ Paper 2:
    Be ready to draw and interpret cladograms, define key terms (clade, synapomorphy), and compare molecular vs morphological evidence in cladistics.