Author: Admin

  • TermDefinition
    PhotosystemProtein–pigment complex in the thylakoid membrane that absorbs light and initiates electron flow.
    PhotolysisSplitting of water by light energy into protons (H⁺), electrons, and oxygen.
    Electron transport chain (ETC)Series of carriers in the thylakoid membrane transferring electrons, releasing energy for proton pumping.
    ChemiosmosisMovement of protons down their electrochemical gradient through ATP synthase, generating ATP.
    NADP⁺ / NADPHFinal electron acceptor in the light-dependent reaction; NADPH carries reducing power to the Calvin cycle.
    PhotophosphorylationLight-driven synthesis of ATP in chloroplasts.
    Cyclic photophosphorylationElectron flow involving only PSI, generating ATP but not NADPH or oxygen.

    The light-dependent reactions of photosynthesis occur in the thylakoid membranes of chloroplasts and capture light energy to produce ATP and NADPH, which power the Calvin cycle. These reactions also generate oxygen as a byproduct from the splitting of water. Two photosystems (PSII and PSI) work together to drive electron flow, enabling the conversion of solar energy into chemical energy.

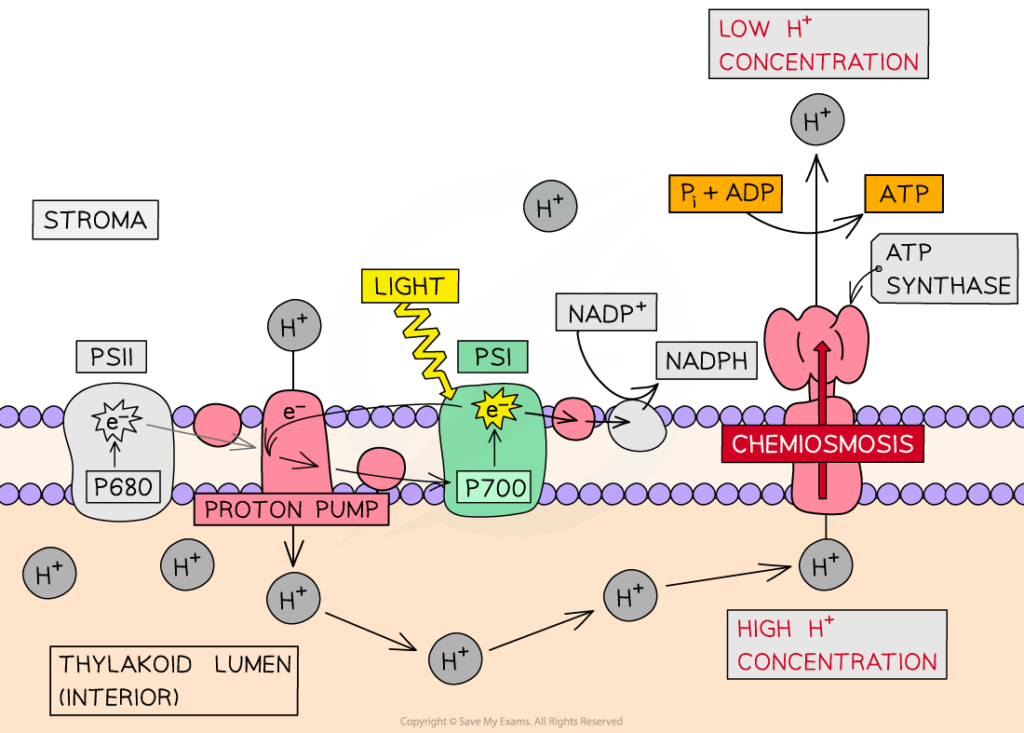
    • Photosystem II (PSII) absorbs photons → energizes electrons in chlorophyll a.
    • Energized electrons pass down the electron transport chain, driving proton pumping into the thylakoid lumen.
    • Lost electrons from PSII are replaced by photolysis of water:
      • H₂O → 2H⁺ + 2e⁻ + ½O₂.
    • Electrons reach Photosystem I (PSI), are re-excited by light, and transferred to NADP⁺ reductase, reducing NADP⁺ → NADPH.
    • Proton gradient drives ATP synthase to produce ATP via chemiosmosis.

    🧠 Examiner Tip: Always state that photolysis occurs at PSII, not PSI. Many students confuse the roles of the two photosystems.
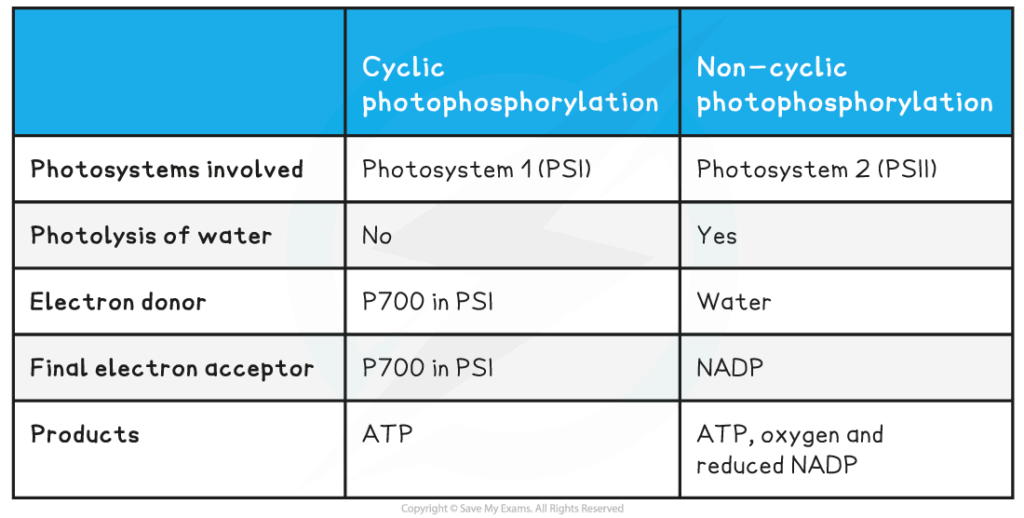
    • Involves only PSI.
    • Electrons cycle back from ferredoxin to the ETC instead of reducing NADP⁺.
    • Produces ATP only (no NADPH, no O₂).
    • Provides extra ATP needed for the Calvin cycle when demand exceeds NADPH.

    🧬 IA Tips & Guidance: Students could test the effect of different light wavelengths on photosynthesis using a colorimeter and leaf discs, linking results to the role of pigments in light absorption.

    • ATP (for Calvin cycle).
    • NADPH (for reduction reactions in Calvin cycle).
    • O₂ (released as a byproduct of photolysis).

    🌐 EE Focus: An EE could investigate the relative contribution of cyclic vs non-cyclic photophosphorylation under stress conditions (e.g., high light intensity, drought).

    • Large surface area of thylakoid membranes accommodates many photosystems and ETC proteins.
    • Thylakoid lumen provides a confined space for rapid proton accumulation.
    • ATP synthase complexes are embedded in membranes, coupling chemiosmosis to ATP synthesis.
    • Grana maximize efficiency of light capture.

    ❤️ CAS Link: Students could design solar panel experiments modeling how light capture and conversion in chloroplasts inspire renewable energy technologies.

    🌍 Real-World Connection: The light-dependent reactions provide the oxygen essential for aerobic life. Artificial photosynthesis research mimics these processes to produce clean fuels like hydrogen. In agriculture, LED lighting tailored to specific wavelengths optimizes crop photosynthesis in greenhouses.

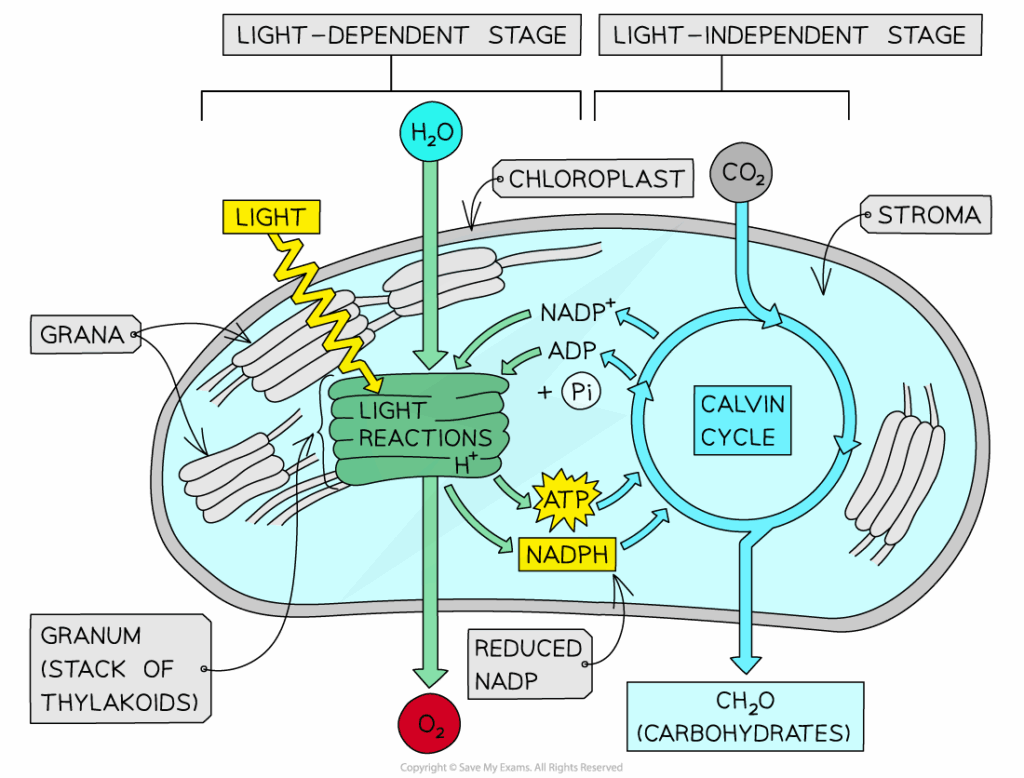
    • Light-dependent reactions supply ATP and NADPH required for carbon fixation in the Calvin cycle.
    • Rate of Calvin cycle is directly dependent on light-dependent reaction outputs.

    🔍 TOK Perspective: Light reactions are modeled using biochemical pathways and spectroscopy. TOK reflection: To what extent can models of invisible processes, like electron flow in thylakoids, be considered reliable knowledge?

    📝 Paper 2: Be ready to outline photolysis, cyclic vs non-cyclic photophosphorylation, products of light reactions, and the structure–function relationship of thylakoids. Data-based questions may involve light wavelength effects or oxygen production rates.

  • TermDefinition
    Aerobic respirationComplete oxidation of glucose in the presence of oxygen, producing CO₂, H₂O, and large amounts of ATP.
    Anaerobic respiration (fermentation)Incomplete breakdown of glucose without oxygen, producing less ATP and byproducts such as lactate or ethanol.
    Facultative anaerobeOrganism that can switch between aerobic and anaerobic respiration depending on oxygen availability (e.g., yeast).
    Obligate anaerobeOrganism that cannot survive in the presence of oxygen.
    Oxygen debtTemporary lack of oxygen in tissues during strenuous exercise, repaid during recovery when lactate is metabolized.
    Lactic acid fermentationAnaerobic pathway in animals where pyruvate is converted into lactate.
    Alcoholic fermentationAnaerobic pathway in yeast where pyruvate is converted into ethanol and CO₂.

    Respiration is the central energy-yielding process in cells. The presence or absence of oxygen determines whether cells use aerobic respiration, which yields high amounts of ATP, or anaerobic respiration, which provides rapid but inefficient ATP production. Both pathways begin with glycolysis, but diverge in how pyruvate is processed. This flexibility allows organisms to adapt to changing environmental conditions and energy demands.

    • Requires oxygen as the final electron acceptor in the electron transport chain.
    • Pyruvate enters the mitochondria → link reaction → Krebs cycle → oxidative phosphorylation.
    • Complete oxidation of glucose yields up to ~36–38 ATP per glucose.
    • Produces CO₂ and H₂O as waste products.
    • Highly efficient, sustaining long-term energy supply in eukaryotic organisms.

    🧠 Examiner Tip: Always emphasize that oxygen is needed only for oxidative phosphorylation as the final electron acceptor, not for glycolysis or the Krebs cycle itself.

    • Occurs when oxygen is absent or limited.
    • Pyruvate is reduced to regenerate NAD⁺, allowing glycolysis to continue.
    • In animals: pyruvate → lactate (lactic acid fermentation).
      • Lactate accumulation causes muscle fatigue; later transported to the liver and converted back to pyruvate (Cori cycle).
    • In yeast/plants: pyruvate → ethanol + CO₂ (alcoholic fermentation).
      • Used in brewing, baking, and biofuel production.
    • Net yield = 2 ATP per glucose, much lower than aerobic respiration.

    🧬 IA Tips & Guidance: Yeast fermentation is a popular IA topic. Students can measure CO₂ output under different sugar types or oxygen availability, linking data to aerobic vs anaerobic pathways.

    • ATP yield: Aerobic = 36–38 ATP; Anaerobic = 2 ATP.
    • Speed: Anaerobic is faster but inefficient; aerobic is slower but sustainable.
    • End products: Aerobic → CO₂ + H₂O; Anaerobic → lactate or ethanol + CO₂.
    • Location: Aerobic = mitochondria; Anaerobic = cytoplasm.
    • Use in organisms: Anaerobic respiration provides short-term energy bursts (e.g., sprinting), aerobic respiration supports long-duration activities.

    🌐 EE Focus: An EE could compare ATP yields in aerobic vs anaerobic organisms, or experimentally analyze fermentation efficiency in yeast under varied oxygen conditions. Another approach is modeling how oxygen availability affects metabolic flux.

    • During vigorous exercise, muscles switch to anaerobic respiration to meet energy demand.
    • Oxygen debt is repaid afterward when lactate is oxidized in the liver.
    • Facultative anaerobes like yeast exploit both pathways depending on environmental oxygen.
    • Obligate anaerobes thrive in oxygen-free niches such as deep soils and sediments.

    ❤️ CAS Link: Students could organize sports-based workshops explaining the science behind aerobic and anaerobic respiration in muscle activity, linking biology to exercise and fitness.

    🌍 Real-World Connection: Fermentation has industrial applications in brewing, baking, yogurt production, and biofuels. Anaerobic respiration in microbes underpins waste treatment and biogas generation. Clinically, understanding lactic acidosis is crucial in emergency medicine, while aerobic deficiencies (mitochondrial diseases) impair energy metabolism.

    • Some organisms have metabolic flexibility (yeast, bacteria).
    • Human muscle fibers specialize:
      • Fast-twitch fibers rely on anaerobic glycolysis.
      • Slow-twitch fibers depend on aerobic respiration with abundant mitochondria.
    • Evolutionary adaptations show how life colonizes both oxygen-rich and oxygen-poor environments.

    🔍 TOK Perspective: ATP yield numbers (36–38 ATP) are based on idealized calculations. TOK reflection: How should science handle uncertainty in data, and how do models balance accuracy with simplicity in teaching complex processes?

    📝 Paper 2: Be ready to compare aerobic and anaerobic respiration, outline products of each, explain oxygen debt, and interpret experimental data (e.g., CO₂ release in yeast). Application questions often involve muscle physiology, fermentation industries, or ATP yield comparisons.

  • TermDefinition
    Krebs cycle (citric acid cycle)A cyclic series of enzyme-catalyzed reactions in the mitochondrial matrix that oxidize acetyl-CoA, releasing CO₂, ATP, NADH, and FADH₂.
    Oxidative phosphorylationATP synthesis driven by electron transport and chemiosmosis in mitochondria.
    Electron transport chain (ETC)Series of protein complexes in the inner mitochondrial membrane that transfer electrons, releasing energy to pump protons.
    ChemiosmosisMovement of protons down their electrochemical gradient through ATP synthase, driving ATP production.
    NADH / FADH₂Reduced coenzymes that donate high-energy electrons to the ETC.
    ATP synthaseEnzyme complex in the inner mitochondrial membrane that couples proton flow to ATP formation.
    CytochromeElectron carrier proteins within the ETC that transfer electrons between complexes.

    The Krebs cycle and oxidative phosphorylation are the final stages of aerobic respiration, occurring in the mitochondria. Together, they extract maximum energy from glucose by oxidizing acetyl-CoA to CO₂ and using the released electrons to generate a proton gradient for ATP synthesis. The Krebs cycle produces electron carriers, while oxidative phosphorylation harnesses their reducing power to make the majority of ATP in respiration.

    • Takes place in the mitochondrial matrix.
    • Acetyl-CoA (2C) combines with oxaloacetate (4C) to form citrate (6C).
    • Through a series of decarboxylations and oxidations, citrate is converted back into oxaloacetate.
    • Per acetyl-CoA (per turn):
      • 3 NADH, 1 FADH₂, 1 ATP (substrate-level), and 2 CO₂ are produced.
    • Per glucose (2 acetyl-CoA):
      • 6 NADH, 2 FADH₂, 2 ATP, 4 CO₂.
    • The cycle is regenerative, ensuring continuous processing of acetyl-CoA.

    🧠 Examiner Tip: Always state that CO₂ is a waste product of respiration, not a source of oxygen in photosynthesis — a common student error.

    • Located in the inner mitochondrial membrane.
    • NADH and FADH₂ donate electrons to the ETC.
    • Electrons flow through protein complexes I–IV, releasing energy.
    • This energy is used to pump protons into the intermembrane space, creating a steep gradient.
    • Protons re-enter the matrix via ATP synthase, which couples the flow to ATP production.
    • Oxygen acts as the final electron acceptor, combining with electrons and protons to form water.
    • Each NADH yields ~3 ATP, each FADH₂ yields ~2 ATP.
    • Total ATP from oxidative phosphorylation per glucose ≈ 34.

    🧬 IA Tips & Guidance: A classic IA experiment is to measure oxygen consumption of respiring seeds or small invertebrates using a respirometer. Link results to ETC activity and oxidative phosphorylation.

    • The ETC rate depends on oxygen availability — if oxygen is absent, oxidative phosphorylation stops.
    • Uncouplers (e.g., DNP) allow protons to leak across the membrane, reducing ATP yield but producing heat.
    • Efficiency of respiration ≈ 34–38% (rest lost as heat).

    🌐 EE Focus: An EE could investigate the effect of inhibitors (cyanide, rotenone) on ETC enzymes or explore the role of mitochondrial adaptations in high-energy tissues like muscle and brain.

    • Highly folded inner membrane (cristae) → large surface area for ETC and ATP synthase.
    • Double membrane creates intermembrane space for proton gradient.
    • Matrix contains enzymes of Krebs cycle and mitochondrial DNA for protein synthesis.
    • Dense distribution of mitochondria in tissues with high energy demand (e.g., cardiac muscle).

    ❤️ CAS Link: Students could run fitness or sports workshops explaining how aerobic respiration supports endurance exercise, connecting biology to healthy lifestyles.

    🌍 Real-World Connection: Mitochondrial diseases often arise from defects in ETC proteins, leading to fatigue and organ failure. In medicine, inhibitors like cyanide highlight the importance of oxygen as the terminal electron acceptor. In industry, oxidative phosphorylation principles are applied in bioenergetics research and drug design for metabolic disorders.

    • Glycolysis: 2 ATP + 2 NADH.
    • Link reaction: 2 NADH.
    • Krebs cycle: 2 ATP + 6 NADH + 2 FADH₂.
    • Oxidative phosphorylation: ~34 ATP.
    • Total: ~38 ATP (in ideal conditions, varies by cell type).

    🔍 TOK Perspective: ATP yield calculations assume idealized conditions. TOK reflection: To what extent can scientific models be treated as exact representations when biological systems are inherently variable?

    📝 Paper 2: Be prepared to outline the Krebs cycle (with yields per glucose), explain oxidative phosphorylation, draw and annotate a mitochondrion, and calculate ATP yield. Application questions may involve effects of inhibitors or oxygen limitation.

  • TermDefinition
    GlycolysisMetabolic pathway in the cytoplasm that breaks down glucose (6C) into two pyruvate (3C) molecules, producing a small yield of ATP and NADH.
    Substrate-level phosphorylationDirect synthesis of ATP by transferring a phosphate group to ADP during glycolysis or Krebs cycle.
    NAD⁺ / NADHCoenzyme that acts as an electron carrier; NAD⁺ is reduced to NADH during glycolysis.
    PyruvateThree-carbon product of glycolysis, central to both aerobic and anaerobic metabolism.
    Link reactionStep connecting glycolysis to the Krebs cycle, where pyruvate is decarboxylated and combined with coenzyme A to form acetyl-CoA.
    Acetyl-CoATwo-carbon molecule that enters the Krebs cycle, carrying acetyl groups derived from carbohydrates, fats, or proteins.

    Cell respiration begins with glycolysis, a universal pathway occurring in the cytoplasm of all living cells. It requires no oxygen and produces a net gain of ATP and NADH. Pyruvate, the end product, is a key metabolic intermediate, entering aerobic or anaerobic pathways depending on oxygen availability. In aerobic organisms, pyruvate is transported into mitochondria for the link reaction, producing acetyl-CoA, which fuels the Krebs cycle. Together, glycolysis and the link reaction form the foundation of cellular energy metabolism.

    • Occurs in the cytoplasm and does not require oxygen.
    • Energy investment phase:
      • 2 ATP molecules are used to phosphorylate glucose into fructose-1,6-bisphosphate.
    • Cleavage phase:
      • The 6C sugar is split into two 3C molecules (glyceraldehyde-3-phosphate).
    • Energy payoff phase:
      • Each 3C molecule is oxidized, producing 2 NADH and 4 ATP (via substrate-level phosphorylation).
    • Net yield per glucose:
      • 2 pyruvate, 2 NADH, and 2 ATP.

    🧠 Examiner Tip: Always specify net ATP gain = 2 (4 produced − 2 used). Many students mistakenly write 4 ATP as the yield of glycolysis.

    • Occurs in the mitochondrial matrix (in eukaryotes).
    • Each pyruvate (3C) undergoes:
      • Decarboxylation: CO₂ is released.
      • Oxidation: NAD⁺ is reduced to NADH.
      • The resulting 2C acetyl group is attached to coenzyme A, forming acetyl-CoA.
    • For each glucose:
      • 2 pyruvate → 2 acetyl-CoA + 2 NADH + 2 CO₂.
    • Acetyl-CoA enters the Krebs cycle, linking cytoplasmic glycolysis to mitochondrial aerobic respiration.

    🧬 IA Tips & Guidance: Students can investigate respiration rate in yeast by measuring CO₂ production with respirometers under different sugar substrates (glucose vs fructose). Link experimental design to glycolysis dependence on substrate type.

    • Phosphofructokinase (PFK) is a key regulatory enzyme inhibited by ATP (feedback inhibition).
    • When ATP is low, PFK is activated, increasing glycolysis.
    • This ensures balance between energy demand and glucose breakdown.

    🌐 EE Focus: An EE could investigate comparative rates of glycolysis in plant vs yeast cells under controlled conditions, or computational modeling of PFK regulation and its effect on ATP yield.

    • Provides ATP rapidly, essential in cells with high, fluctuating energy demands (e.g., muscle cells).
    • Produces pyruvate as a metabolic hub — can enter aerobic respiration, anaerobic fermentation, or biosynthetic pathways.
    • NADH generated provides reducing power for oxidative phosphorylation.
    • The link reaction ensures carbohydrate breakdown is efficiently integrated into mitochondrial metabolism.

    ❤️ CAS Link: Students could create interactive models or demonstrations showing how glucose in foods (bread, fruits) is broken down into ATP, linking biology to everyday nutrition and health awareness.

    🌍 Real-World Connection: Glycolysis is exploited in cancer diagnosis because tumor cells show increased glycolytic activity even in oxygen presence (Warburg effect). Clinically, glycolytic enzymes are used as biomarkers for metabolic disorders. In biotechnology, fermentation industries (bread, beer, bioethanol) rely on glycolysis in yeast to produce CO₂ and ethanol.

    • Under aerobic conditions → enters mitochondria for link reaction → Krebs cycle.
    • Under anaerobic conditions → converted into lactate (in animals) or ethanol + CO₂ (in yeast).
    • This dual role highlights glycolysis as a universal and adaptable pathway.

    🔍 TOK Perspective: Glycolysis was elucidated using indirect biochemical experiments long before modern imaging. TOK reflection: How do scientists build reliable models of processes they cannot directly observe, and to what extent can indirect evidence be trusted?

    📝 Paper 2: Be ready to outline the steps and products of glycolysis, describe the link reaction, compare aerobic vs anaerobic fates of pyruvate, and calculate ATP yields. Data questions may ask for interpretation of graphs showing oxygen consumption or fermentation rates.

  • TermDefinition
    Metabolic pathwayA series of enzyme-catalyzed reactions that convert a starting molecule into a product.
    CatabolismBreakdown of complex molecules into simpler ones, releasing energy (e.g., respiration).
    AnabolismSynthesis of complex molecules from simpler ones, requiring energy (e.g., photosynthesis, protein synthesis).
    Feedback inhibitionRegulation where the end-product of a pathway inhibits an earlier enzyme, preventing overproduction.
    Allosteric regulationControl of enzyme activity by binding of molecules to regulatory sites (not the active site), changing enzyme conformation.
    IsoenzymesDifferent enzymes that catalyze the same reaction but may differ in regulation or conditions of activity.
    MetaboliteIntermediate product formed during a metabolic pathway.

    Metabolism is the sum of all biochemical reactions in an organism. These reactions are highly organized into pathways, ensuring efficiency and control. Pathways can be linear (glycolysis), cyclic (Krebs cycle), or branched (amino acid biosynthesis). Enzymes play key roles in controlling these pathways, allowing cells to regulate energy supply, adapt to environmental changes, and maintain homeostasis. Without regulation, metabolic chaos would occur, wasting energy and resources.

    • Linear pathways: substrates converted step-by-step into final products (e.g., glycolysis converting glucose to pyruvate).
    • Cyclic pathways: regenerate initial substrate with each turn (e.g., Krebs cycle, Calvin cycle).
    • Branched pathways: intermediates serve as entry/exit points for multiple products (e.g., amino acid biosynthesis).
    • Compartmentalization (e.g., mitochondria, chloroplasts, cytoplasm) allows separation of catabolic and anabolic pathways, preventing interference.

    🧠 Examiner Tip: Examiners often ask for named examples of pathways. Always link structure (linear, cyclic) to function with specific cases like glycolysis or Krebs cycle.

    • Catabolic pathways:
      • Break down complex molecules (polysaccharides, lipids, proteins).
      • Release energy stored in chemical bonds.
      • Example: cellular respiration (glucose → ATP).
    • Anabolic pathways:
      • Build complex molecules from simple precursors.
      • Require energy input, often ATP and reducing power (NADPH).
      • Example: photosynthesis, protein synthesis, glycogen synthesis.
    • These pathways are interconnected, with catabolism providing energy for anabolism.

    🧬 IA Tips & Guidance: Students could investigate enzyme regulation in respiration by measuring CO₂ output in yeast under varying glucose concentrations. Alternatively, experiments with inhibitors (e.g., cyanide on respiration) demonstrate pathway control.

    • Rate-limiting steps: often controlled by allosteric enzymes sensitive to product/substrate levels.
    • Feedback inhibition:
      • End-product inhibits first committed step.
      • Example: isoleucine inhibits threonine deaminase in amino acid synthesis.
    • Covalent modification: phosphorylation/dephosphorylation alters enzyme activity.
    • Allosteric activation: presence of a metabolite enhances enzyme activity.
    • Regulation ensures efficiency and prevents accumulation of intermediates.

    🌐 EE Focus: An EE could explore computational modeling of metabolic networks, or experimentally analyze how nutrient availability alters enzyme activity in fermentation vs aerobic respiration.

    • Energy carriers (ATP, NADH, FADH₂, NADPH) link catabolic and anabolic reactions.
    • Respiration: glycolysis, Krebs cycle, and oxidative phosphorylation integrate for maximum ATP yield.
    • Photosynthesis: light-dependent reactions provide ATP and NADPH for the Calvin cycle.
    • Amino acid, lipid, and carbohydrate metabolism are interconnected through shared intermediates (e.g., acetyl-CoA, pyruvate).

    ❤️ CAS Link: Students could design nutrition awareness campaigns showing how metabolic pathways explain balanced diets (carbohydrates, fats, proteins) and energy supply, linking biochemistry to public health.

    🌍 Real-World Connection: Disruption of metabolic pathways leads to disease (e.g., PKU from defective phenylalanine metabolism, diabetes from impaired glucose regulation). Drugs often target metabolic enzymes (statins inhibit cholesterol synthesis, methotrexate blocks nucleotide synthesis). In biotechnology, metabolic engineering redirects pathways for biofuel or pharmaceutical production.

    • Metabolism is highly interconnected; altering one pathway affects many others.
    • Systems biology uses computational models to map metabolic fluxes.
    • Isotopic labeling (e.g., C¹⁴ glucose) helps trace metabolites in pathways.
    • These approaches show metabolism as a network, not isolated chains of reactions.

    🔍 TOK Perspective: Metabolic pathways are human-constructed models. TOK reflection: To what extent do pathway diagrams represent reality, or are they simplifications of a far more complex biochemical network?

    📝 Paper 2: Be ready to distinguish catabolic vs anabolic pathways, describe linear vs cyclic pathways with examples, explain feedback inhibition, and discuss regulation of enzyme activity. Application questions may link pathways to disease or biotechnology.

  • TermDefinition
    Enzyme kineticsThe study of the rates of enzyme-catalyzed reactions.
    Activation energyThe minimum energy required for a reaction to occur, lowered by enzymes.
    Optimum conditionsThe specific temperature and pH at which an enzyme functions most efficiently.
    InhibitorA molecule that decreases enzyme activity by interfering with substrate binding or catalysis.
    Competitive inhibitionInhibition where an inhibitor binds to the active site, blocking substrate binding.
    Non-competitive inhibitionInhibition where an inhibitor binds to an allosteric site, altering enzyme conformation and reducing activity.
    VmaxThe maximum velocity of an enzyme-catalyzed reaction when active sites are saturated.
    Km (Michaelis constant)The substrate concentration at which reaction rate is half of Vmax; a measure of enzyme affinity for substrate.

    Enzyme activity is central to metabolism, as enzymes control the speed of virtually all biochemical reactions. The rate of activity depends on both the enzyme’s structure and environmental conditions. Factors such as temperature, pH, substrate concentration, and the presence of inhibitors or activators influence how efficiently enzymes catalyze reactions. Understanding these effects allows us to explain metabolic adaptation, regulate industrial processes, and design medical therapies.

    • Enzymes increase reaction rate by stabilizing the transition state and lowering activation energy.
    • Reaction rate depends on substrate concentration:
      • At low concentrations → rate increases linearly with more substrate.
      • At high concentrations → rate levels off as enzymes become saturated (Vmax).
    • Km provides a measure of affinity:
      • Low Km = high affinity (enzyme effective at low substrate levels).
      • High Km = low affinity.

    🧠 Examiner Tip: Always draw enzyme activity graphs with proper labeling (x-axis = substrate concentration, y-axis = rate). Mark Vmax and Km clearly for full marks.

    • Temperature:
      • Increases kinetic energy → more collisions → faster reaction.
      • Past optimum (~37°C in humans), heat disrupts hydrogen bonds, leading to denaturation.
    • pH:
      • Affects ionization of active site residues and substrate.
      • Each enzyme has an optimum pH (e.g., pepsin ~pH 2, trypsin ~pH 8).
      • Extreme pH causes denaturation and loss of activity.

    🧬 IA Tips & Guidance: Classic IA designs include measuring catalase activity (oxygen release from H₂O₂) under different pH or temperature conditions. Use quantitative data (gas volume, colorimetry, pressure sensors) to strengthen analysis.

    • Competitive inhibition:
      • Inhibitor resembles substrate and binds to active site.
      • Can be overcome by increasing substrate concentration.
      • Example: Malonate inhibiting succinate dehydrogenase.
    • Non-competitive inhibition:
      • Inhibitor binds to allosteric site, changing enzyme shape.
      • Substrate may still bind, but reaction rate is reduced.
      • Cannot be overcome by increasing substrate concentration.
    • Feedback inhibition:
      • End-product of a pathway inhibits an enzyme earlier in the chain.
      • Prevents overproduction and conserves resources.
      • Example: Isoleucine inhibiting threonine deaminase.

    🌐 EE Focus: An EE could explore enzyme inhibition experimentally (e.g., effect of competitive vs non-competitive inhibitors on catalase). Alternatively, computational modeling could investigate how active site mutations affect Km and Vmax.

    • Cofactors and coenzymes are often essential for catalysis.
    • Enzyme concentration: higher enzyme levels → higher reaction rate until substrate becomes limiting.
    • Substrate availability: critical in metabolic control; shortage reduces activity.
    • Physical environment: solvents, ionic strength, and crowding in the cytoplasm affect enzyme efficiency.

    ❤️ CAS Link: Students could design workshops where participants test enzyme activity in household products (detergents with proteases, pineapple juice breaking down gelatin), linking science experiments to real-world applications.

    🌍 Real-World Connection:
    Knowledge of enzyme activity is applied in medicine (enzyme inhibitors as drugs, e.g., ACE inhibitors for hypertension), food industry (lactase to produce lactose-free milk), and diagnostics (measuring enzyme levels as disease markers). Enzyme stability research is key in biotechnology, where enzymes must function under industrial conditions.

    • Typical enzyme activity graphs include:
      • Substrate concentration vs rate (Michaelis–Menten).
      • Temperature vs rate (bell-shaped curve).
      • pH vs rate (bell-shaped curve).
    • Inhibition curves show differences:
      • Competitive → higher Km, same Vmax.
      • Non-competitive → same Km, lower Vmax.

    🔍 TOK Perspective: Enzyme activity is modeled mathematically (Michaelis–Menten equation). TOK reflection: How far can mathematical models capture biological complexity, and where do they oversimplify reality?

    📝 Paper 2: Be ready to draw/interpret enzyme activity graphs, distinguish competitive vs non-competitive inhibition, explain feedback inhibition, and describe effects of pH and temperature. Application questions often link enzyme activity to metabolic pathways or industrial/medical uses.

  • TermDefinition
    EnzymeA biological catalyst, usually a protein, that speeds up biochemical reactions without being consumed.
    Active siteSpecific region on an enzyme where the substrate binds and catalysis occurs.
    SubstrateThe reactant molecule upon which an enzyme acts.
    SpecificityThe ability of an enzyme to act on a particular substrate due to complementary shape and chemical properties.
    CofactorA non-protein component (metal ion or organic molecule) required for enzyme activity.
    ApoenzymeProtein portion of an enzyme without its cofactor.
    HoloenzymeComplete, active enzyme consisting of apoenzyme plus cofactor.

    Enzymes are essential for life because they accelerate chemical reactions that would otherwise occur too slowly to sustain metabolism. They provide specificity, efficiency, and regulation, enabling organisms to maintain homeostasis. Most enzymes are globular proteins whose unique 3D conformation determines their catalytic function. Enzymes lower activation energy by stabilizing the transition state, allowing reactions to proceed rapidly under physiological conditions of temperature and pH.

    • Enzymes are primarily globular proteins with a unique tertiary or quaternary structure.
    • Their active site is a small, highly specific region formed by amino acid residues.
    • Specificity arises from complementary shapes, charges, and hydrophobic interactions between enzyme and substrate.
    • Cofactors expand enzyme functionality:
      • Metal ions (Mg²⁺, Zn²⁺, Fe²⁺) assist in catalysis.
      • Coenzymes (organic molecules like NAD⁺, FAD, CoA) act as carriers of electrons or chemical groups.
    • Enzymes exhibit induced fit: binding of the substrate induces slight conformational changes, optimizing interaction and catalysis.
    • The polypeptide folding and stability are maintained by hydrogen bonds, ionic bonds, disulfide bridges, and hydrophobic interactions.

    🧠 Examiner Tip: Always emphasize that enzymes lower activation energy but do not change the overall free energy (ΔG) of the reaction. This is a frequent exam misconception.

    • Catalytic efficiency: Enzymes increase reaction rates by factors of up to 10⁶–10¹².
    • Specificity: Each enzyme acts only on one or a few related substrates (e.g., sucrase hydrolyzes sucrose but not lactose).
    • Reusability: Enzymes are not consumed; a single enzyme molecule can catalyze many reactions.
    • Mild conditions: Enzymes operate at physiological temperatures and pH, unlike harsh industrial catalysts.
    • Saturation kinetics: Reaction rate increases with substrate concentration until all active sites are occupied.
    • Regulation: Enzymes can be activated or inhibited by molecules, allowing fine-tuned metabolic control.

    🧬 IA Tips & Guidance: Enzyme catalysis is a classic IA theme. Investigations could test the effect of temperature, pH, or inhibitors on catalase activity (measured by O₂ release) or amylase (starch breakdown). Always justify how chosen conditions affect enzyme structure and activity.

    • DNA polymerase: requires Mg²⁺ for nucleotide addition.
    • Carbonic anhydrase: Zn²⁺ at its active site catalyzes CO₂ hydration.
    • Dehydrogenases: use NAD⁺/FAD as coenzymes to transfer electrons in respiration.
    • Hemoglobin (not an enzyme but an example of cofactor use): requires Fe²⁺ in heme group.

    🌐 EE Focus: An EE could explore comparative enzyme structure using bioinformatics — e.g., structural similarities among hydrolases, or evolution of active sites in oxidoreductases. Another option is studying the effect of cofactors on enzyme kinetics experimentally.

    • Enzymes are localized in specific organelles to maintain efficiency:
      • Mitochondria → Krebs cycle enzymes.
      • Chloroplasts → photosynthetic enzymes.
      • Lysosomes → hydrolytic enzymes at acidic pH.
    • Compartmentalization prevents interference between pathways and creates optimal microenvironments.
    • Multienzyme complexes (e.g., pyruvate dehydrogenase) channel substrates directly between enzymes, increasing efficiency.

    ❤️ CAS Link: Students could design community activities demonstrating enzyme presence in everyday life (e.g., pineapple juice breaking down gelatin, detergent enzymes digesting stains), linking biology to food science and sustainability.

    🌍 Real-World Connection: Enzymes are widely used in biotechnology and medicine. Industrial applications include amylases in brewing, proteases in detergents, and lipases in food processing. Clinically, enzymes serve as biomarkers (elevated amylase in pancreatitis), therapeutic agents (streptokinase dissolving clots), and drug targets (HIV protease inhibitors). Enzyme deficiencies (e.g., lactase deficiency → lactose intolerance) illustrate their importance for health.

    • Enzyme function depends on the stability of their 3D conformation.
    • High temperatures or extreme pH disrupt hydrogen bonds and ionic interactions, causing denaturation.
    • Denatured enzymes lose active site shape → no substrate binding or catalysis.
    • This property underpins food preservation (pasteurization) and sterilization techniques.

    🔍 TOK Perspective: Much of enzyme knowledge comes from indirect observation (e.g., reaction rates, crystallography). TOK reflection: How reliable are models built from indirect experimental evidence, and to what extent do they represent reality?

    📝 Paper 2: Be ready to describe enzyme properties, draw/label enzyme–substrate interactions, explain induced fit vs lock-and-key, and relate enzyme specificity to structure. Questions may ask for cofactors, compartmentalization, or effects of denaturation.

  • TermDefinition
    AdaptationStructural, physiological, or behavioural trait enhancing survival and reproduction in a specific niche.
    Generalist speciesSpecies with broad niches, tolerating a wide range of conditions and resources (e.g., raccoons, cockroaches).
    Specialist speciesSpecies with narrow niches, requiring specific conditions or resources (e.g., koalas, giant pandas).
    Climate changeLong-term shifts in temperature, precipitation, and other abiotic factors altering niches.
    Invasive speciesNon-native organisms that establish, spread, and disrupt native niche structures.
    Phenotypic plasticityThe ability of an organism to alter physiology, behaviour, or morphology in response to environmental changes.

    Niches are not static — they adapt and shift in response to environmental pressures. Climate change, habitat destruction, invasive species, and pollution all drive niche modifications. Species may persist by altering behaviour, physiology, or morphology, but some fail to adapt and decline. Generalists are often favoured under rapid change, while specialists are most at risk. Over evolutionary timescales, these pressures lead to new niches, extinctions, and the reshaping of ecosystems.

    • Specialists thrive in stable ecosystems but collapse when conditions shift, as seen with coral reefs facing ocean acidification.
    • Generalists tolerate disturbances, broad diets, and flexible behaviours — traits that promote survival in urban and altered ecosystems.
    • Human activity often favours generalists (rats, pigeons, weeds), creating “winner” species.
    • Trade-offs: specialists are highly efficient but vulnerable; generalists are less efficient but resilient.
    • Extinction risk is strongly correlated with niche breadth; narrow niches are the most fragile under global change.

    🧠 Examiner Tip: Don’t just define specialists and generalists. Always link their niche flexibility to survival under environmental stress (e.g., climate change).

    • Climate change shifts temperature and precipitation ranges, forcing species to move, adapt, or die out.
    • Poleward and altitudinal shifts are observed as organisms track cooler climates.
    • Ocean warming and acidification alter niches of marine organisms, especially corals and shellfish.
    • Human-driven pressures (pollution, habitat fragmentation, overexploitation) accelerate niche loss.
    • Some species adapt via phenotypic plasticity, modifying physiology or behaviour without genetic change.
    • Others undergo rapid evolutionary shifts if populations have sufficient genetic diversity.

    🧬 IA Tips & Guidance: Students could analyse historical data on species distributions (e.g., bird ranges, flowering times) to illustrate niche shifts under climate change.

    • Invasive species often outcompete natives by occupying similar niches but with higher efficiency.
    • Examples: grey squirrels displacing red squirrels in the UK; zebra mussels monopolising freshwater habitats.
    • Invasives often expand realised niches beyond their native ranges, exploiting the absence of predators.
    • They alter food webs, change nutrient cycling, and compress native niches.
    • Some natives adapt to coexist (niche shift), but many decline or go extinct.
    • Human transport and trade accelerate introductions and expansion of invasives globally.

    🌐 EE Focus: An EE could examine how invasive species restructure niches in a local ecosystem, comparing realised niche breadth of native vs invasive populations.

    • Behavioural: migration, altered foraging, nocturnal activity in response to heat stress.
    • Physiological: altered breeding cycles, tolerance to new salinity or pH ranges.
    • Morphological: body size changes (Bergmann’s Rule), altered coloration for camouflage in new habitats.
    • Symbiotic relationships shift: corals switch algal partners under stress to survive warming seas.
    • Ecosystem engineers (beavers, termites) reshape habitats, creating new niches for other species.
    • Species lacking adaptive flexibility face population crashes or extinction.

    ❤️ CAS Link: A CAS project could involve community work on restoring habitats for specialist species (e.g., butterfly gardens, bird boxes), showing how niches can be supported by human intervention.

    🌍 Real-World Connection: Conservation biology depends on understanding niches — e.g., reintroduction programs require knowledge of food and habitat niches (wolves in Yellowstone, pandas in China). Climate mitigation strategies also consider assisted migration to new niches.

    • Natural selection drives niche evolution — populations with advantageous traits expand into new roles.
    • Adaptive radiation (Darwin’s finches) shows how environmental change can diversify niches.
    • Coevolution with other species (predators, prey, symbionts) creates dynamic niche networks.
    • Human activity accelerates evolutionary pressures, producing rapid microevolution in urban wildlife (e.g., pesticide resistance in insects).
    • Extinction of one species can free niches for others, restructuring ecosystems.
    • Over long timescales, environmental change is a key driver of speciation and biodiversity.

    🔍 TOK Perspective: Niche adaptation illustrates the interplay of reductionism and holism. While models reduce adaptation to traits like tolerance ranges, survival depends on integrated systems (behaviour + environment + genetics). TOK issue: how reliable are models for predicting future survival under climate change?

    📝 Paper 2: Exam questions may involve comparing specialists vs generalists, analysing invasive species impacts, or predicting responses to climate change. Data-based questions often use distribution maps, climate models, or population trends. Full-mark answers must integrate examples (corals, grey squirrels, finches, pandas) and link adaptation strategies to environmental change.

  • TermDefinition
    Fundamental nicheThe full range of abiotic and biotic conditions under which a species could survive and reproduce in the absence of competition.
    Realised nicheThe actual niche a species occupies, restricted by competition, predation, or other interactions.
    Competitive exclusion principleThe principle that no two species can indefinitely occupy the same niche when resources are limited; one species will outcompete the other.
    Niche partitioningThe division of resources among coexisting species to reduce direct competition.
    Resource overlapThe degree to which species use the same resources, which influences competition intensity.
    CoevolutionReciprocal adaptations in interacting species, driving niche differentiation over time.

    Interactions among species play a central role in shaping niches. While the fundamental niche represents the full potential of a species, biotic interactions often restrict it to a narrower realised niche. Competition, predation, and symbiosis determine how species coexist, and niche partitioning allows multiple species to survive within the same habitat by reducing direct competition. These dynamics not only determine community structure but also influence evolutionary change, as species adapt in response to one another.

    • The fundamental niche reflects an organism’s full tolerance range for abiotic conditions (e.g., light, salinity, temperature).
    • The realised niche is usually narrower, determined by pressures from competitors, predators, or mutualistic partners.
    • Example: Barnacle studies (Connell, 1961) show that Chthamalus occupies higher tidal zones due to exclusion from lower zones by Balanus.
    • Fundamental niches can expand if competitors are removed, a phenomenon known as competitive release.
    • Species with broader realised niches (generalists) cope better with competition than specialists.
    • Niche compression occurs when many species overlap in resource use, forcing narrower realised niches to avoid exclusion.

    🧠 Examiner Tip: Diagrams of overlapping fundamental vs realised niches often appear in exams. Always label axes (resource gradient, abundance) and state the role of competition in shifting niche boundaries.

    • Gause’s experiments with Paramecium showed that two species competing for identical resources cannot coexist — one will always outcompete the other.
    • Competitive exclusion drives ecological separation: species must diverge in behaviour, feeding, or timing to persist.
    • This principle underpins the structure of natural communities, ensuring each species occupies a unique ecological role.
    • Invasive species often disrupt existing balances by excluding natives from their niches.
    • Resource availability and environmental variability can sometimes relax exclusion, allowing coexistence.
    • Coexistence is possible if niches are differentiated, but prolonged overlap leads to displacement or extinction of one competitor.

    🧬 IA Tips & Guidance: Simple classroom models of competition (yeast, protozoa, or bacterial cultures) can be used to illustrate exclusion and resource limitation. Field transects can also demonstrate displacement patterns between invasive and native plant species.

    • Partitioning reduces competition by dividing resources spatially, temporally, or behaviourally.
    • Spatial partitioning: Warbler species forage at different levels of the same tree, avoiding direct overlap.
    • Temporal partitioning: Nocturnal rodents avoid diurnal competitors, reducing overlap in food access.
    • Morphological partitioning: Beak size differences in Darwin’s finches correspond to different seed sizes.
    • Partitioning is dynamic — in times of resource scarcity, overlap may increase temporarily.
    • Over evolutionary timescales, partitioning can lead to character displacement, where species diverge morphologically or behaviourally.

    🌐 EE Focus: An EE could test niche partitioning in a local ecosystem, e.g., comparing feeding behaviour of bird species in urban vs rural areas, or analysing pollinator activity patterns over time.

    • Predators indirectly shape prey niches by influencing where and when prey forage (“landscape of fear”).
    • Prey adapt through camouflage, mimicry, toxins, or behavioural changes (grouping, vigilance).
    • Predators also specialise, reducing overlap by targeting distinct prey (e.g., owls vs hawks hunting at night/day).
    • Mutualisms (e.g., pollinators and plants) broaden realised niches by creating interdependent resource relationships.
    • Parasitism narrows host niches by reducing health, altering feeding or reproductive roles.
    • Keystone predators maintain biodiversity by preventing competitive exclusion among prey species.

    ❤️ CAS Link: Students could design interactive workshops explaining predator–prey adaptations with role-play or simulations, helping younger students understand ecological balance.

    🌍 Real-World Connection: Conservation strategies often involve protecting predator populations because their removal leads to prey overpopulation, reduced diversity, and niche collapse (e.g., wolves in Yellowstone).

    • Coevolution occurs when species reciprocally influence each other’s adaptations, leading to niche changes.
    • Classic example: flowers and pollinators evolve specialised relationships (long nectar tubes vs long proboscis).
    • Predator–prey “arms races” drive adaptations such as faster predators and evasive prey.
    • Symbiotic relationships evolve stability — e.g., corals and zooxanthellae share niches through mutual benefits.
    • Over long timescales, coevolution can generate biodiversity by diversifying niches.
    • Climate change and human disturbance may disrupt these evolved niche relationships, leading to mismatches.

    🔍 TOK Perspective: Niche differentiation is often modelled in simplified diagrams of overlap and partitioning. TOK issue: do such reductionist models (e.g., graphs of resource use) obscure the complexity of multi-species interactions in real ecosystems?

    📝 Paper 2: Questions may ask for comparisons of fundamental vs realised niches, explanations of competitive exclusion, or examples of partitioning. Data-based questions often show resource-use graphs or barnacle zonation data. High-mark answers require clear examples (Paramecium, barnacles, warblers, finches) and linking mechanisms (competition, adaptation) to outcomes.

  • TermDefinition
    Ecological nicheThe role and position a species has in its environment, including its use of resources, interactions, and contribution to energy flow.
    HabitatThe physical location where an organism lives; distinct from its niche.
    Fundamental nicheThe full range of environmental conditions under which a species can survive and reproduce.
    Realised nicheThe actual niche occupied, limited by competition, predation, and other biotic factors.
    Specialist speciesSpecies with narrow niches, adapted to very specific environmental conditions.
    Generalist speciesSpecies with broad niches, capable of surviving in varied conditions and using diverse resources.

    The concept of a niche is central to ecology, as it defines not only where a species lives but also how it interacts with its environment. Unlike a habitat, which is purely spatial, a niche includes feeding habits, behavioural patterns, and relationships with other organisms. Niches prevent species from directly overlapping in resource use, thereby structuring communities. Understanding niches allows ecologists to explain biodiversity, predict species distributions, and assess the impact of environmental changes.

    • A niche integrates abiotic factors (temperature, salinity, pH, oxygen) with biotic interactions (competition, predation, symbiosis).
    • Feeding niches include diet specialisation, feeding times, and foraging methods (e.g., nocturnal vs diurnal predators).
    • Spatial niches describe where organisms forage or reproduce — e.g., canopy birds vs understory birds.
    • Temporal niches reduce competition by shifting activity times — e.g., desert rodents active at night.
    • Uniqueness of niches underlies the competitive exclusion principle: no two species can indefinitely occupy the same niche.

    🧠 Examiner Tip: Avoid simply equating “niche = habitat.” Always stress role + function + interactions. Diagrams contrasting habitat vs niche are common assessment tools.

    • The fundamental niche is the theoretical range of conditions under which a species can survive.
    • The realised niche is narrower, reflecting limits imposed by competition, predation, or symbiosis.
    • Example: Barnacle species — Chthamalus can survive lower shore zones but is excluded by Balanus competition.
    • Realised niches may expand if competitors are removed (competitive release).
    • Niche compression occurs in ecosystems with high biodiversity, forcing narrower roles.

    🧬 IA Tips & Guidance: Practicals can involve observing species distribution in transects (e.g., barnacles along a shore gradient) and inferring fundamental vs realised niches.

    • Specialists (e.g., koalas, which eat only eucalyptus) are highly efficient in stable conditions but vulnerable to environmental change.
    • Generalists (e.g., rats, cockroaches) survive across varied habitats due to dietary and behavioural flexibility.
    • The balance between specialists and generalists explains why some species thrive in disturbed ecosystems while others decline.
    • Specialists often occupy narrow ecological roles that reduce direct competition.
    • Evolution may shift species along the specialist-generalist continuum depending on environmental pressures.

    🌐 EE Focus: An EE could examine whether specialists or generalists are more successful under climate change, using case studies of invasive vs endemic species.

    • Abiotic constraints: temperature tolerance, salinity, moisture, oxygen levels.
    • Biotic constraints: competition for food, predator pressure, mutualistic partners.
    • Keystone species shape the niches of others by altering resource availability.
    • Disturbances (fires, storms, human activity) reset niche availability and open opportunities for colonisers.
    • Human introduction of invasive species disrupts native niche structures.

    ❤️ CAS Link: Students could design an awareness campaign about invasive species in their local area, showing how they disrupt native niches.

    🌍 Real-World Connection: Habitat fragmentation narrows niches, often pushing species to extinction. Conservation biologists must understand niche requirements to design reserves and corridors.

    • Niches structure communities by distributing species across resource gradients.
    • Greater niche diversity often correlates with greater biodiversity.
    • Overlap between niches may result in competition unless partitioned.
    • Mutualisms (pollinators and flowers) create interdependent niche networks.
    • Energy flow in ecosystems is structured by trophic niches (producer, consumer, decomposer).

    🔍 TOK Perspective: Niches are conceptual models. TOK issue: Are niches “real entities” or human constructs to simplify complex ecological interactions?

    📝 Paper 2: Expect questions contrasting habitat vs niche, defining fundamental vs realised niches, and explaining specialist vs generalist strategies. Data-based questions often include graphs of resource overlap or transect results.