Author: Admin

  • TermDefinition
    EutrophicationExcessive nutrient enrichment in water leading to algal blooms and oxygen depletion.
    Greenhouse gasesAtmospheric gases (COβ‚‚, CHβ‚„, Nβ‚‚O) that trap heat, driving climate change.
    Ecological footprintThe measure of human demand on Earth’s ecosystems relative to their capacity.
    BioaccumulationThe build-up of toxic substances within organisms over time.
    BiomagnificationIncrease in toxin concentration at higher trophic levels in food chains.
    SustainabilityThe ability to use resources in ways that meet current needs without compromising future generations.

    Human activity has profoundly altered natural transfers of energy and matter. Agriculture, industry, and urbanisation disrupt nutrient cycles, reduce productivity, and degrade ecosystem stability. Climate change, pollution, and habitat destruction further magnify these impacts. Understanding these disruptions is critical for developing strategies toward sustainability and global environmental management.

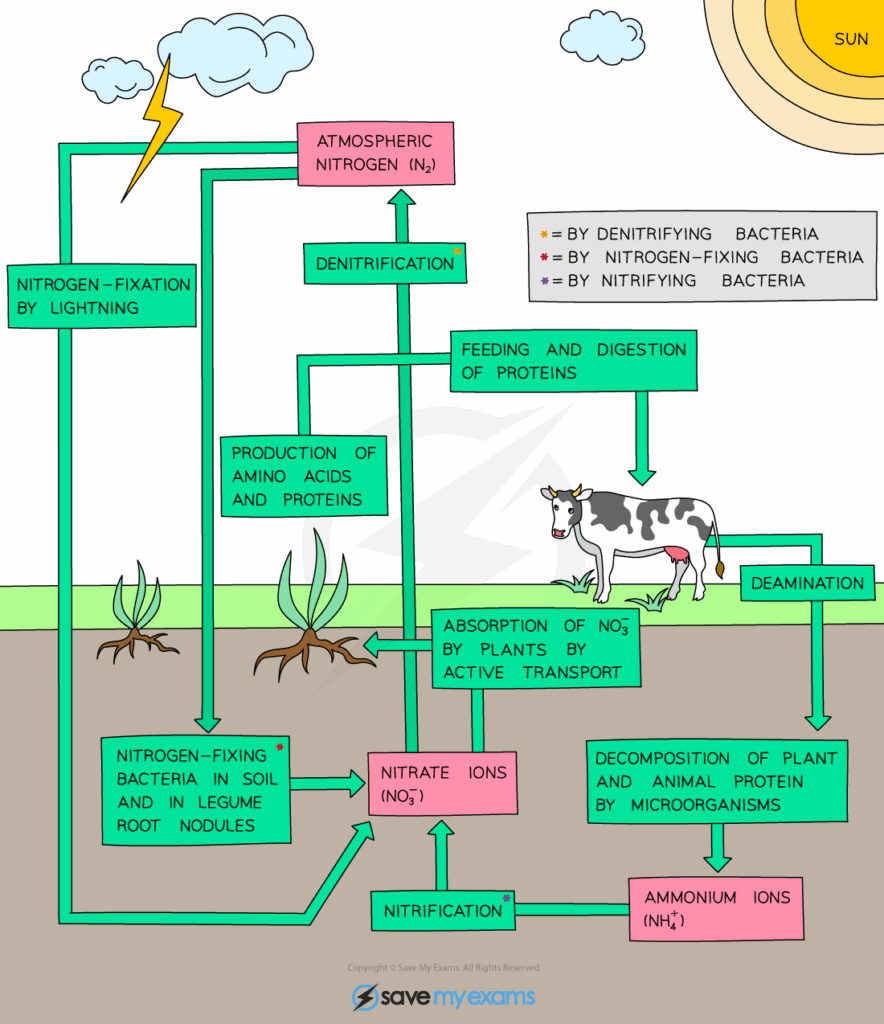
    • Fertilisers boost productivity but disrupt nitrogen and phosphorus cycles.
    • Pesticides reduce pest populations but bioaccumulate in ecosystems.
    • Monoculture farming lowers biodiversity and resilience.
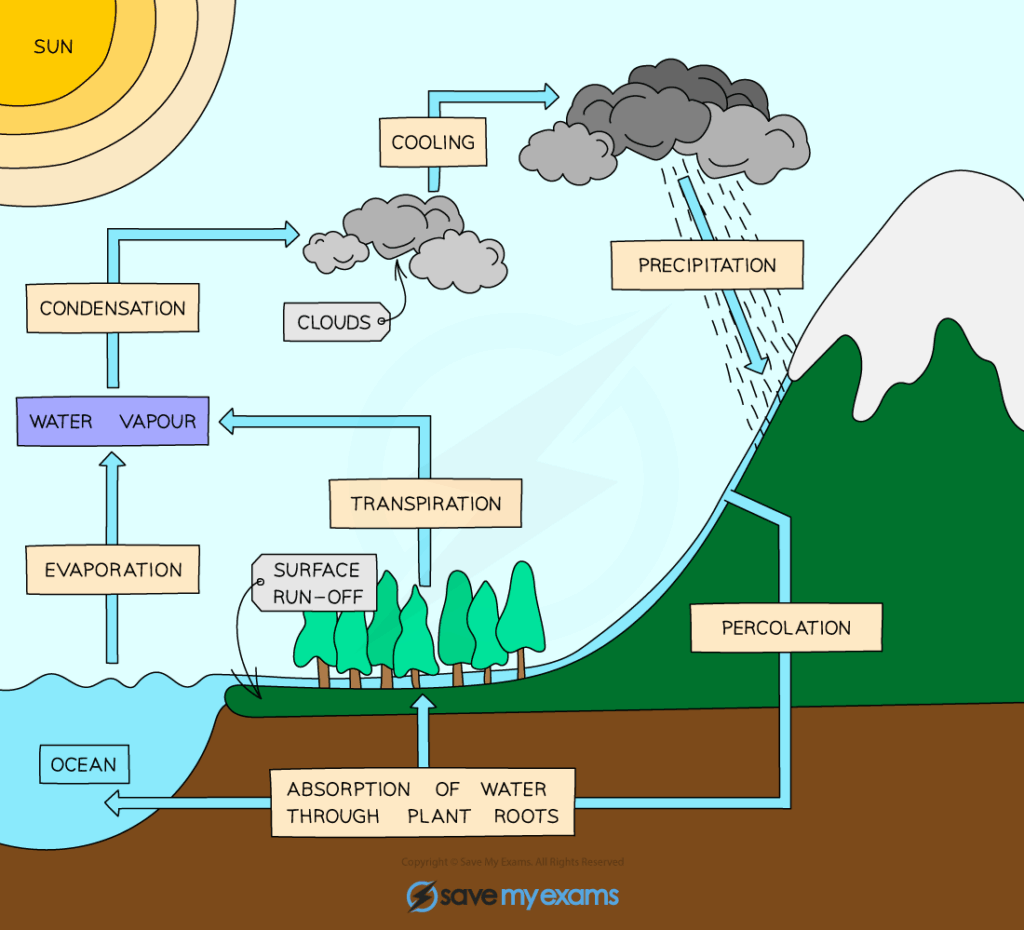
    • Irrigation alters water cycles, depleting aquifers.
    • Intensive livestock farming increases methane emissions.

    🧠 Examiner Tip: Always distinguish between short-term benefits (increased yields) and long-term costs (eutrophication, soil degradation).

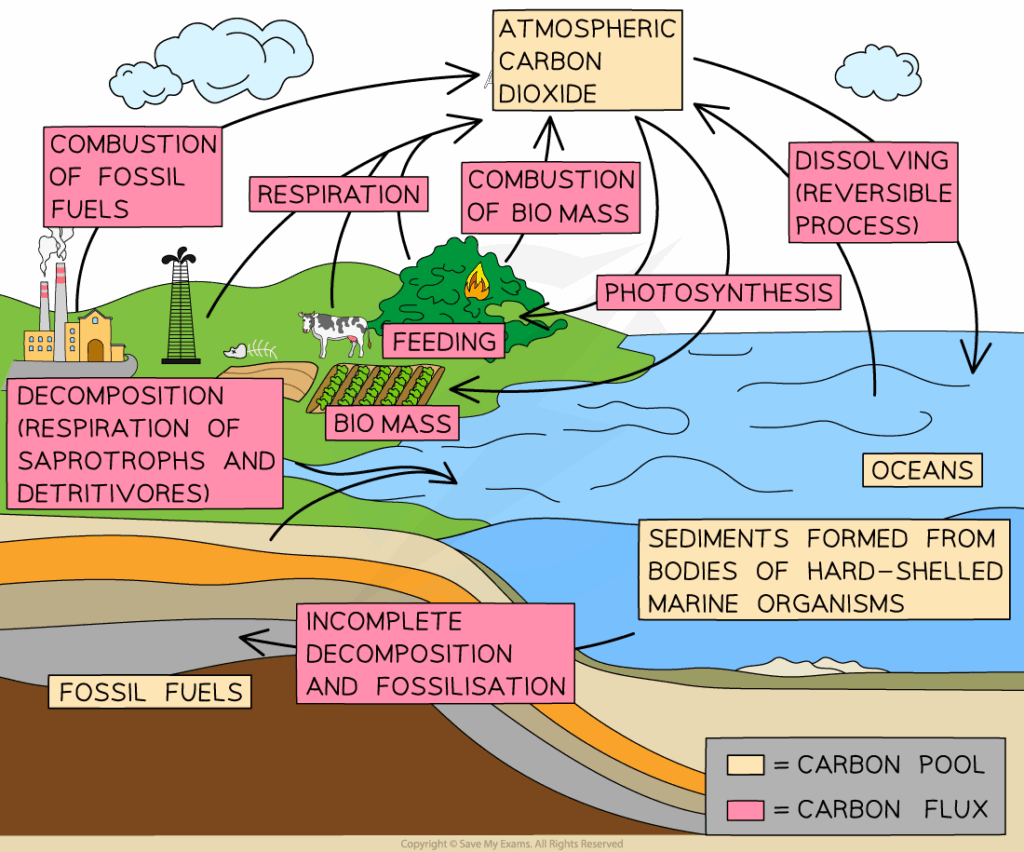
    • Burning fossil fuels releases greenhouse gases, altering the carbon cycle.
    • Industrial waste pollutes air, soil, and water.
    • Urbanisation increases runoff, reducing infiltration and groundwater recharge.
    • Heat islands alter local climate and energy flow.
    • Deforestation for industry reduces carbon sinks and disrupts water cycling.

    🧬 IA Tips & Guidance: Students could test local water bodies for nitrate/phosphate levels to evaluate eutrophication from agriculture or urban runoff.

    • Increased COβ‚‚, methane, and nitrous oxide enhance greenhouse effect.
    • Leads to global warming, altered precipitation, rising sea levels.
    • Ocean acidification harms coral reefs and marine food webs.
    • Melting permafrost releases methane, creating feedback loops.
    • Ecosystems shift ranges, threatening biodiversity.

    🌐 EE Focus: An EE could analyse carbon footprints of different lifestyles, linking human behaviour to measurable ecosystem impacts.

    • Heavy metals (mercury, lead) bioaccumulate in organisms, harming health.
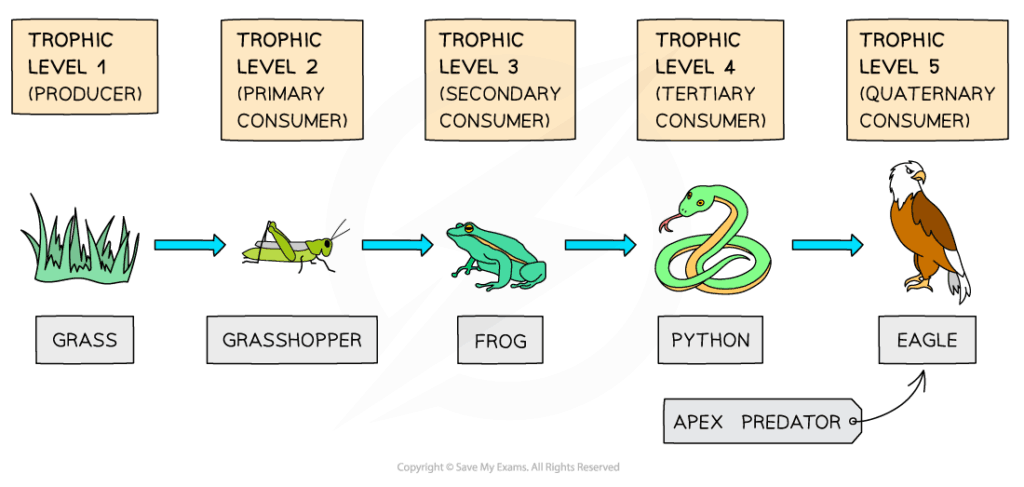
    • Biomagnification increases toxin levels at higher trophic levels (e.g., DDT in birds of prey).
    • Plastic pollution disrupts marine ecosystems and energy flow.
    • Oil spills destroy habitats and reduce productivity.
    • Pollution disrupts both nutrient cycles and energy transfer.

    ❀️ CAS Link: Students could organise clean-up drives or awareness campaigns on reducing plastic use and sustainable consumption.

    🌍 Real-World Connection: The Minamata disease (Japan) showed mercury biomagnification effects. DDT restrictions arose from ecological damage (e.g., Silent Spring). Climate change remains the biggest global consequence of human impacts.

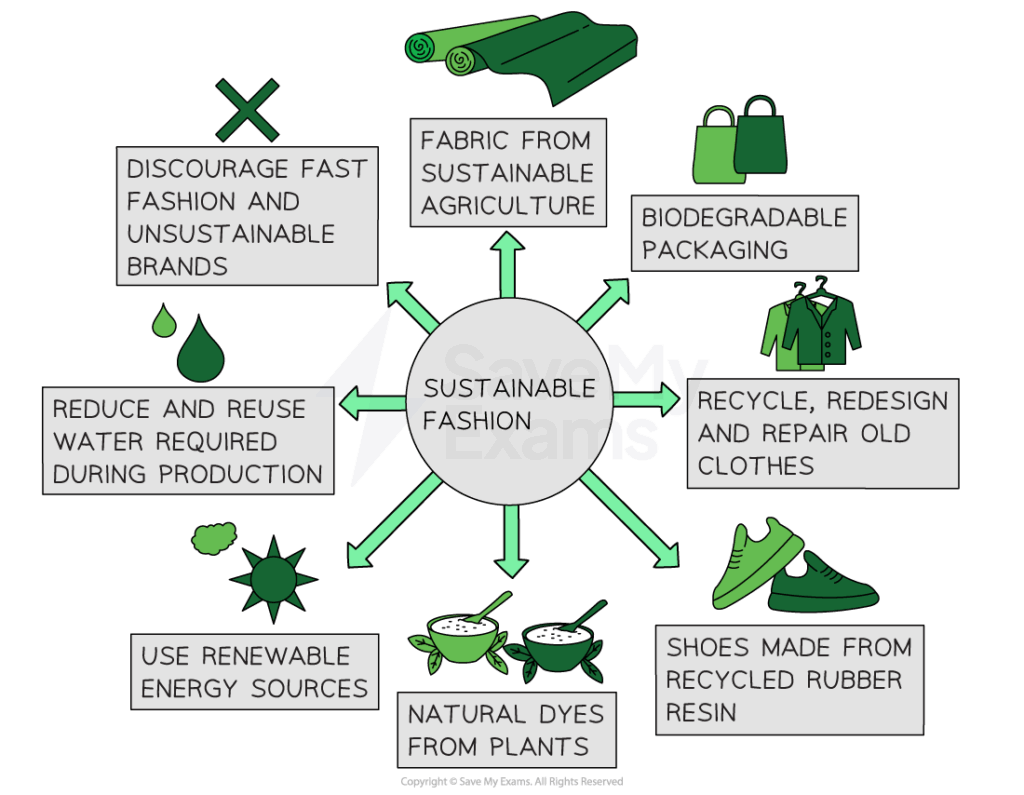
    • Sustainable agriculture: crop rotation, reduced fertiliser use, organic methods.
    • Renewable energy reduces COβ‚‚ emissions.
    • Conservation: protecting carbon sinks (forests, wetlands) and biodiversity.
    • Recycling and waste management reduce ecological footprint.
    • Education and policy drive sustainable behaviour globally.

    πŸ” TOK Perspective: Human impacts are studied with scientific data, but solutions involve ethics, politics, and culture. TOK question: How do value systems influence what counts as β€œsustainable”?

    πŸ“ Paper 2: Questions may involve explaining eutrophication, describing bioaccumulation, or analysing greenhouse gas graphs. Expect evaluation of human impacts with examples.

  • TermDefinition
    Biogeochemical cycleThe movement of elements through living organisms and the abiotic environment.
    Carbon cycleThe cycling of carbon between atmosphere, organisms, soil, and oceans.
    Nitrogen cycleThe cycling of nitrogen between atmosphere, soil, organisms, and water.
    FixationConversion of atmospheric Nβ‚‚ into usable nitrogen compounds by bacteria or lightning.
    TranspirationLoss of water vapour from plant leaves to the atmosphere.
    RunoffWater movement over land, carrying nutrients into rivers and oceans.

    Matter cycles continuously through ecosystems, linking organisms to their environment. Key elements like carbon, nitrogen, and water cycle through biotic and abiotic processes, sustaining life and enabling productivity. These cycles are powered by energy flow but differ from energy in that matter is recycled. Human activity is increasingly altering these natural cycles, leading to global challenges like climate change, eutrophication, and water scarcity.

    • Carbon enters the biosphere via photosynthesis, stored in biomass.
    • Respiration by organisms returns COβ‚‚ to the atmosphere.
    • Decomposers release carbon from dead matter into soil and air.
    • Long-term storage occurs in fossil fuels, peat, and ocean sediments.
    • Human burning of fossil fuels increases atmospheric COβ‚‚, driving climate change.

    🧠 Examiner Tip: Remember: photosynthesis = COβ‚‚ sink, respiration/combustion = COβ‚‚ source.

    • Atmospheric nitrogen (Nβ‚‚) is inert; must be fixed into usable forms (NH₃, NO₃⁻).
    • Nitrogen-fixing bacteria (in soil or root nodules) convert Nβ‚‚ to ammonia.
    • Nitrifying bacteria convert ammonia β†’ nitrites β†’ nitrates (usable by plants).
    • Denitrifying bacteria return nitrogen to the atmosphere.
    • Fertilisers and sewage disrupt natural cycling, causing eutrophication.

    🧬 IA Tips & Guidance: Students could measure nitrate levels in water samples to study human impacts on nitrogen cycling.

    • Evaporation and transpiration transfer water to the atmosphere.
    • Condensation forms clouds; precipitation returns water to land and oceans.
    • Infiltration and percolation replenish groundwater.
    • Runoff returns water to rivers and oceans, carrying nutrients.
    • Human use (irrigation, reservoirs, deforestation) alters flows.

    🌐 EE Focus: An EE could investigate how human activity modifies local water cycles (e.g., urbanisation reducing infiltration, increasing runoff).

    • Carbon and water cycles are linked: transpiration moves both water and carbon.
    • Nitrogen availability influences plant growth, altering carbon storage.
    • Ocean acidification reflects excess COβ‚‚ disrupting marine nutrient cycles.
    • Global climate change alters precipitation patterns, affecting all cycles.
    • Biogeochemical cycles are interconnected, not isolated loops.

    ❀️ CAS Link: Students could participate in water conservation projects or local tree planting to promote sustainable nutrient cycling.

    🌍 Real-World Connection: Deforestation reduces carbon storage and disrupts water cycling. Industrial agriculture drives nitrogen pollution. These impacts contribute to climate change and ecosystem collapse.

    • Fossil fuel combustion β†’ excess COβ‚‚ β†’ global warming.
    • Fertilisers β†’ nitrogen runoff β†’ eutrophication and dead zones.
    • Deforestation β†’ reduced carbon sequestration and transpiration.
    • Overuse of freshwater β†’ aquifer depletion, droughts.
    • Human disruption alters balance, threatening biodiversity and food security.

    πŸ” TOK Perspective: Models of nutrient cycles are presented as closed loops. TOK issue: To what extent do simplified diagrams hide the complexity and unpredictability of human impacts?

    πŸ“ Paper 2: Questions may ask to compare cycles, explain nitrogen fixation, or interpret carbon flux data. Graphs often involve COβ‚‚ seasonal variation or fertiliser effects.

  • TermDefinition
    Trophic levelThe feeding position of an organism in a food chain (e.g., producer, primary consumer).
    ProductivityThe rate at which energy is accumulated in biomass by organisms.
    Gross primary productivity (GPP)Total energy captured by producers via photosynthesis.
    Net primary productivity (NPP)Energy available to consumers after producers’ respiration (NPP = GPP – respiration).
    Energy transfer efficiencyThe percentage of energy transferred from one trophic level to the next (usually ~10%).
    BiomassThe total dry mass of living material in an ecosystem.

    Energy enters ecosystems through photosynthesis and flows through food chains as organisms consume one another. At each trophic level, energy is lost as heat, waste, or used for metabolic processes, limiting the length of food chains and shaping ecosystem structure. Productivity measures how efficiently energy is converted into biomass and varies with environmental conditions. Understanding energy flow is fundamental to ecology and human management of ecosystems.

    • Producers (plants, algae, cyanobacteria) capture solar energy and form the base of food webs.
    • Consumers occupy higher trophic levels: primary consumers (herbivores), secondary consumers (carnivores), tertiary predators.
    • Decomposers recycle nutrients and release energy stored in dead matter.
    • Energy decreases at each level due to metabolic losses, limiting food chains to 4–5 levels.
    • Energy pyramids represent decreasing energy and biomass with increasing trophic level.

    🧠 Examiner Tip: Always distinguish between energy flow (one way) and nutrient cycling (recycling). Many students confuse the two.

    • Gross primary productivity (GPP): total energy fixed by photosynthesis.
    • Net primary productivity (NPP): GPP – respiration; energy available to consumers.
    • NPP varies by ecosystem: highest in tropical rainforests, lowest in deserts and open oceans.
    • Climate (light, temperature, water, nutrients) strongly influences productivity.
    • Productivity sets the energy budget for entire ecosystems.

    🧬 IA Tips & Guidance: Students can measure NPP using light/dark bottle experiments with aquatic plants to quantify oxygen production as a proxy for photosynthesis.

    • Only ~10% of energy is transferred to the next trophic level.
    • Losses occur due to respiration, excretion, undigested food, and heat.
    • Transfer efficiency varies: herbivores may be more efficient than carnivores; ectotherms waste less energy than endotherms.
    • Efficiency influences population sizes at different trophic levels.
    • Humans exploit efficiency by eating lower on food chains (plants vs meat).

    🌐 EE Focus: An EE could compare energy transfer efficiency in different ecosystems (aquatic vs terrestrial) and its implications for food security.

    • Energy pyramids always upright, reflecting loss at each level.
    • Biomass pyramids may be inverted in aquatic ecosystems due to rapid turnover of phytoplankton.
    • Food webs show interconnections among species, not just linear chains.
    • Keystone species play critical roles in maintaining energy pathways.
    • Disturbances (removal of predators, climate change) disrupt flows.

    ❀️ CAS Link: Students could create educational posters or food web models to teach younger students about energy transfer in ecosystems.

    🌍 Real-World Connection: Energy efficiency principles are applied in sustainable agriculture and aquaculture, promoting diets with lower ecological footprints.

    • Humans shorten food chains by directly consuming producers (crops) and primary consumers (fish, livestock).
    • Overfishing and deforestation disrupt natural energy pathways.
    • Agriculture maximises NPP by fertilisers, irrigation, and genetic modification.
    • Intensive farming increases yields but reduces ecosystem stability.
    • Renewable energy use in ecosystems (e.g., solar panels in agroforestry) integrates natural flows with human needs.

    πŸ” TOK Perspective: Energy pyramids simplify complex ecosystems into neat models. TOK issue: Do such diagrams oversimplify by ignoring detritus-based food webs and recycling pathways?

    πŸ“ Paper 2: Expect questions on calculating NPP, interpreting pyramids, or comparing ecosystems. Data-based questions may show productivity graphs.

  • TermDefinition
    SuccessionThe gradual change in community composition over time.
    Primary successionSuccession starting on bare rock or newly formed surfaces with no soil.
    Secondary successionSuccession in disturbed areas where soil remains (e.g., after fire).
    Pioneer speciesThe first species to colonise new or disturbed environments.
    Climax communityA stable, self-sustaining community at the end of succession.
    ResilienceThe ability of an ecosystem to recover after disturbance.

    Ecological succession describes how communities change over time, driven by species colonisation, competition, and modification of the environment. Succession increases biodiversity and complexity until a stable climax community is established. However, disturbances such as fire, storms, or human activity can reset succession. Ecosystem stability depends on resilience β€” the capacity to recover after such events

    • Begins on bare rock (volcanic islands, retreating glaciers).
    • Pioneer species (lichens, mosses) colonise first, breaking rock into soil.
    • Soil formation allows grasses, shrubs, and eventually trees to grow.
    • Increases organic matter, nutrient cycling, and habitat complexity.
    • Takes hundreds to thousands of years to reach a climax community.

    🧠 Examiner Tip: Distinguish clearly between primary and secondary succession β€” many students mix them up.

    • Occurs after disturbances that remove communities but leave soil intact.
    • Faster than primary succession because soil and seeds remain.
    • Common after forest fires, floods, or abandoned farmland.
    • Communities rebuild through stages: weeds β†’ grasses β†’ shrubs β†’ trees.
    • Biodiversity recovers more quickly than in primary succession.

    🧬 IA Tips & Guidance: Students can monitor succession in school grounds (e.g., abandoned plots) over months, recording species diversity.

    • Climax community is the endpoint of succession: stable, high biodiversity.
    • Composition depends on climate (e.g., tropical rainforest vs desert).
    • Dynamic equilibrium: communities remain stable but not static.
    • Disturbances (storms, fires) may shift communities into new stable states.
    • Human activity (logging, farming) often prevents climax formation.

    🌐 EE Focus: An EE could compare primary vs secondary succession in local ecosystems, using biodiversity indices to track recovery.

    • Ecosystems vary in resilience β€” ability to bounce back after disturbance.
    • High diversity often increases resilience by providing functional redundancy.
    • Keystone species contribute to recovery capacity.
    • Disturbance regimes (frequency, intensity) determine community pathways.
    • Low resilience ecosystems risk collapse under repeated stress.

    ❀️ CAS Link: Students could support local ecological restoration projects, such as planting native species in degraded areas.

    🌍 Real-World Connection: Succession and resilience are central to habitat restoration, rewilding, and conservation strategies. Climate change increases disturbance frequency, testing ecosystem stability.

    • Agriculture and urbanisation halt natural succession.
    • Invasive species alter successional pathways by outcompeting natives.
    • Fire suppression changes natural disturbance regimes, reducing biodiversity.
    • Restoration ecology seeks to guide succession towards desired outcomes.
    • Humans both hinder and manage succession processes.

    πŸ” TOK Perspective: Succession is often depicted as a linear pathway to climax. TOK issue: Do such models ignore the unpredictability and multiple possible outcomes of real ecosystems?

    πŸ“ Paper 2: Questions may involve distinguishing primary vs secondary succession, explaining resilience, or analysing biodiversity changes after disturbance. Data often include graphs of species richness over time.

  • TermDefinition
    CommunityAll the populations of different species living and interacting in the same area.
    PredationAn interaction where one organism (predator) kills and consumes another (prey).
    CompetitionWhen two or more species or individuals vie for the same limited resource.
    SymbiosisA close and long-term interaction between species, which may be mutualistic, commensal, or parasitic.
    MutualismA symbiotic interaction where both species benefit.
    Keystone speciesA species that has a disproportionately large effect on community structure.

    Community interactions shape biodiversity and ecosystem structure. Predation, competition, and symbiosis are central to regulating population sizes, resource availability, and species coexistence. These interactions drive natural selection, coevolution, and niche differentiation, creating dynamic and resilient ecosystems.

    • Predators regulate prey populations, preventing overgrazing or overpopulation.
    • Predator–prey cycles often oscillate, with prey abundance driving predator numbers.
    • Prey evolve defences: camouflage, toxins, mimicry, behavioural adaptations.
    • Predators evolve counter-adaptations (speed, stealth, venom).
    • Predation can increase biodiversity by reducing dominance of competitive prey species.

    🧠 Examiner Tip: Don’t just describe β€œpredators eat prey.” Use examples of coevolution (e.g., cheetahs and gazelles).

    • Intraspecific competition: occurs within a species for food, mates, or territory.
    • Interspecific competition: between different species; may lead to competitive exclusion or niche partitioning.
    • Competitive exclusion principle: no two species can occupy the same niche indefinitely.
    • Partitioning reduces overlap β€” e.g., birds feeding in different canopy layers.
    • Competition influences community diversity and stability.

    🧬 IA Tips & Guidance: Experiments with plants in limited soil can model competition for nutrients.

    • Mutualism: both species benefit (bees pollinating flowers).
    • Commensalism: one benefits, other unaffected (barnacles on whales).
    • Parasitism: one benefits at the expense of the other (tapeworms in intestines).
    • Obligate vs facultative symbiosis depends on whether the relationship is essential.
    • Symbioses increase ecological complexity and resilience.

    🌐 EE Focus: An EE could compare symbiotic relationships in different ecosystems (e.g., coral reefs vs forests) and assess their role in maintaining biodiversity.

    • Keystone species disproportionately affect ecosystems (e.g., sea otters control urchins, protecting kelp forests).
    • Removal of keystone species causes trophic cascades and biodiversity loss.
    • Foundation species shape environments by creating habitats (e.g., coral reefs, trees in forests).
    • Both types highlight interdependence within communities.
    • Conservation prioritises keystone species for ecosystem stability.

    ❀️ CAS Link: Students could create community awareness posters on local keystone species and their ecological roles.

    🌍 Real-World Connection: Conservation efforts often focus on predators (wolves in Yellowstone) because of their keystone role in restoring ecosystems.

    • Coevolution shapes predator-prey, host-parasite, and mutualistic interactions.
    • Symbiotic interactions can drive diversification of species niches.
    • Community stability arises from a balance of competition, predation, and cooperation.
    • Invasive species disrupt coevolved interactions, destabilising communities.
    • Interactions are dynamic, shifting with environmental change.

    πŸ” TOK Perspective: Interactions are often categorised as predation, competition, or symbiosis, but real relationships are fluid. TOK question: Are human-made categories oversimplifications of continuous ecological processes?

    πŸ“ Paper 2: Questions may involve predator-prey graphs, explaining competition outcomes, or classifying symbiosis examples. Expect data analysis on niche partitioning.

  • TermDefinition
    PopulationA group of individuals of the same species living in the same area at the same time.
    Population densityThe number of individuals per unit area or volume.
    Population growth rateThe change in the number of individuals in a population over time.
    Carrying capacity (K)The maximum number of individuals an environment can sustain long-term without degradation.
    Density-dependent factorsBiotic factors (e.g., competition, predation, disease) that regulate population size.
    Density-independent factorsAbiotic factors (e.g., weather, natural disasters) that affect populations regardless of density.

    Population dynamics describe how populations change in size, density, and distribution over time and space. They are influenced by births, deaths, immigration, and emigration. Growth follows predictable patterns such as exponential and logistic models, but real populations are shaped by density-dependent and density-independent factors. Understanding these dynamics is crucial for ecology, conservation, and resource management

    • Exponential growth: occurs under ideal conditions, producing a J-shaped curve; limited in real ecosystems.
    • Logistic growth: incorporates carrying capacity (K), producing an S-shaped curve; more realistic for natural populations.
    • Growth rate depends on birth and death rates as well as immigration/emigration.
    • Overshooting K can lead to population crashes due to resource depletion.
    • Human populations show modified growth due to technology and medicine.

    🧠 Examiner Tip: Always link growth models to real examples (e.g., bacterial exponential growth in lab vs logistic growth in wild populations).

    • High densities increase competition for resources, mates, and territory.
    • Density-dependent factors (disease, predation, competition) regulate population near K.
    • Density-independent factors (storms, droughts) can abruptly reduce populations.
    • Allee effect: very low densities reduce survival (difficulty finding mates, cooperative defence loss).
    • Regulation ensures populations remain in dynamic equilibrium with resources.

    🧬 IA Tips & Guidance: Fieldwork could include quadrat sampling or mark–recapture to estimate population size and density.

    • Clumped distribution: most common; reflects patchy resources or social behaviour (herds, flocks, schools).
    • Uniform distribution: results from territoriality or competition (e.g., nesting seabirds).
    • Random distribution: occurs when resources are uniform and interactions minimal.
    • Distribution patterns can change with seasons or life stages.
    • Spatial distribution affects interactions, survival, and reproduction.

    🌐 EE Focus: An EE could analyse population density and distribution in a chosen species, linking to environmental variables and conservation implications.

    • Habitat destruction reduces carrying capacity.
    • Overhunting and exploitation cause population crashes.
    • Conservation efforts (wildlife reserves, captive breeding) stabilise endangered species.
    • Human populations show unique dynamics due to medical, agricultural, and industrial advances.
    • Urbanisation creates high-density environments with distinct ecological challenges.

    ❀️ CAS Link: Students could organise biodiversity surveys in their school grounds to track insect or plant population densities over time.

    🌍 Real-World Connection: Fisheries management depends on understanding logistic growth and avoiding overharvesting beyond sustainable yield.

    • Predator-prey cycles demonstrate population oscillations (e.g., lynx–hare).
    • Competition regulates densities through resource limitation.
    • Keystone species strongly affect community population structures.
    • Populations within ecosystems are never isolated; their dynamics are interdependent.
    • Long-term monitoring reveals trends in ecosystem health and resilience.

    πŸ” TOK Perspective: Population models simplify reality β€” e.g., J and S curves. TOK issue: To what extent do such mathematical models capture the unpredictability of real ecosystems?

    πŸ“ Paper 2: Questions may involve interpreting population graphs, calculating growth rates, or comparing density-dependent vs density-independent factors. Data questions often use predator-prey cycles.

  • TermDefinition
    VaccineA preparation of antigens that stimulates adaptive immunity without causing disease.
    ImmunisationThe process of inducing immunity via vaccination.
    Herd immunityProtection of unvaccinated individuals when a critical proportion of a population is immune.
    Booster doseA repeated vaccination that enhances memory and prolongs immunity.
    Attenuated vaccineVaccine using weakened but live pathogens.
    Subunit vaccineVaccine containing only parts of a pathogen (proteins, polysaccharides) that trigger immunity.

    Vaccination harnesses adaptive immunity by exposing individuals to harmless forms of antigens, priming memory B and T cells for future encounters with the pathogen. This creates a rapid, strong secondary immune response upon real infection. Vaccination not only protects individuals but also communities through herd immunity. Modern biotechnology has expanded vaccine types, including mRNA and recombinant vaccines. However, challenges remain in vaccine distribution, hesitancy, and evolving pathogens

    • Vaccines introduce antigens without causing full disease.
    • Stimulate clonal selection of B and T cells β†’ formation of memory cells.
    • On re-exposure, immune memory produces rapid, high-level responses.
    • Can use whole pathogens (killed/attenuated) or components (subunits, toxoids).
    • New technologies: mRNA vaccines instruct cells to produce pathogen proteins, triggering immunity.

    🧠 Examiner Tip: Always explain that vaccines do not provide immediate protection β€” they prepare immune memory for future encounters.

    • Live attenuated: strong, long-lasting immunity; risk in immunocompromised patients (e.g., measles, polio Sabin).
    • Inactivated: killed pathogens; safer but often weaker response (e.g., influenza).
    • Subunit: only antigens, very safe but need boosters (e.g., HPV).
    • Toxoid: inactivated toxins (e.g., tetanus, diphtheria).
    • mRNA and vector-based: cutting-edge, highly effective, adaptable to new pathogens (e.g., COVID-19 vaccines).

    🧬 IA Tips & Guidance: Investigations can model vaccine impact using simulations of herd immunity, showing how increasing vaccination rates reduce disease spread.

    • Vaccines create memory B and T cells for long-term protection.
    • Booster shots re-stimulate memory cells, raising antibody levels.
    • Some vaccines provide lifelong immunity (measles), others need regular boosters (tetanus, flu).
    • Immune memory explains why childhood vaccinations are scheduled in series.
    • Variability in pathogen mutation rates affects duration of immunity.

    🌐 EE Focus: An EE could compare immune memory durability across vaccine types, or analyse how mutation rates (e.g., influenza vs measles) affect vaccination strategies.

    • Herd immunity occurs when enough people are immune, limiting pathogen spread.
    • Protects vulnerable groups (infants, elderly, immunocompromised).
    • Requires high vaccination coverage; threshold depends on pathogen transmissibility.
    • Public trust, education, and access determine success of herd immunity.
    • Loss of herd immunity (due to hesitancy) can trigger disease resurgence.

    ❀️ CAS Link: Students could run awareness projects on the importance of vaccines in their community, addressing myths and highlighting global equity issues.

    🌍 Real-World Connection: COVID-19 demonstrated the power of rapid vaccine development, but also the challenges of equitable access and misinformation. Vaccination campaigns remain central to eradicating diseases like polio and measles.

    • Pathogen mutation (antigenic drift/shift in influenza) requires frequent updates.
    • Vaccine hesitancy threatens public health.
    • Ethical dilemmas: mandatory vaccination vs individual freedom.
    • Global inequality: low-income countries struggle with access and infrastructure.
    • Future vaccines may target chronic diseases (e.g., cancer, HIV).

    πŸ” TOK Perspective: Vaccines raise TOK issues about knowledge, trust, and uncertainty. Scientific evidence strongly supports vaccination, but social perspectives (beliefs, values) influence acceptance. TOK question: How does trust in science shape public health decisions?

    πŸ“ Paper 2: Questions may involve explaining how vaccines work, comparing vaccine types, or describing herd immunity. Data-based questions often show antibody levels after vaccination and boosters. Full marks require linking memory cell formation to long-term protection.

  • TermDefinition
    Adaptive immunityA specific immune defence that develops after exposure to a pathogen, involving memory.
    AntigenA foreign molecule that triggers an immune response.
    B cellsLymphocytes that mature in bone marrow and produce antibodies.
    T cellsLymphocytes that mature in the thymus, coordinating and regulating immune responses.
    AntibodyA protein secreted by plasma cells that specifically binds to antigens.
    Memory cellsLong-lived lymphocytes that remain after infection, providing faster responses upon re-exposure.

    Adaptive immunity provides specific, long-lasting defence against pathogens. Unlike innate immunity, it tailors responses to particular antigens and creates memory for future encounters. It involves B cells, which produce antibodies, and T cells, which regulate and destroy infected cells. Adaptive immunity is slower to develop but highly effective, underpinning vaccination strategies

    • B cells recognise antigens via surface receptors (membrane-bound antibodies).
    • Once activated (with T helper cell support), they differentiate into:
      • Plasma cells: secrete large amounts of antibodies.
      • Memory B cells: provide long-term immunity.
    • Antibodies neutralise toxins, opsonise pathogens, and activate complement.
    • Different classes of antibodies (IgG, IgA, IgM) serve specialised roles.
    • Antibody diversity arises from gene rearrangements during B cell development.

    🧠 Examiner Tip: Don’t confuse plasma cells (short-lived, secrete antibodies) with memory B cells (long-lived, no immediate secretion).

    • Helper T cells (Th): release cytokines, activate B cells and cytotoxic T cells.
    • Cytotoxic T cells (Tc): kill virus-infected and cancer cells by releasing perforins and granzymes.
    • Regulatory T cells (Treg): suppress excessive immune responses, preventing autoimmunity.
    • Memory T cells: ensure rapid responses on re-exposure.
    • T cells require antigen presentation by major histocompatibility complex (MHC) molecules.

    🧬 IA Tips & Guidance: Students could model antibody–antigen interactions using lock-and-key analogies, or use ELISA-based classroom kits to demonstrate antibody binding.

    • Each B or T cell has unique antigen receptors generated randomly.
    • When a specific antigen binds, that cell is β€œselected” and undergoes rapid clonal expansion.
    • Creates a population of cells with the same specificity.
    • This process explains the specificity and adaptability of immune responses.
    • Memory cells formed during clonal expansion underpin long-term immunity.

    🌐 EE Focus: An EE could examine how clonal selection theory revolutionised immunology, comparing historical and modern models of immune specificity.

    • Antigen-presenting cells (APCs) like dendritic cells activate T helper cells.
    • Cytokines from innate immune cells influence adaptive responses.
    • Adaptive responses enhance innate immunity (antibodies activate complement, opsonisation).
    • Both systems are interdependent, not separate.
    • Failures in integration (e.g., HIV destroying helper T cells) cripple immunity.

    ❀️ CAS Link: Students could create peer-to-peer teaching sessions using role-play to model immune cell interactions (e.g., APCs, B cells, T cells as characters).

    🌍 Real-World Connection: HIV specifically targets helper T cells, weakening adaptive immunity. Immunotherapy for cancer harnesses T cells (CAR-T therapy), showing adaptive immunity’s medical potential.

    • Primary response: slower, with lower antibody levels.
    • Secondary response: faster, stronger, due to memory B and T cells.
    • This principle underlies vaccination strategies.
    • Specificity ensures pathogens are targeted precisely, minimising collateral damage.
    • Autoimmune diseases occur when specificity fails, and self-antigens are targeted.

    πŸ” TOK Perspective: Adaptive immunity is often described as the body β€œlearning.” But is this metaphor misleading? Memory in biology is chemical and cellular, not conscious. TOK question: How far can we extend human metaphors like β€œmemory” and β€œrecognition” to scientific processes?

    πŸ“ Paper 2: Questions may involve comparing B and T cell functions, explaining clonal selection, or describing primary vs secondary immune responses. Data questions often show antibody concentration graphs over time. Use precise terminology (plasma cells, memory cells, cytokines).

  • TermDefinition
    Innate immunityThe non-specific, immediate defence mechanism present from birth, acting against a wide range of pathogens.
    Physical barriersExternal defences such as skin and mucous membranes that block pathogen entry.
    PhagocytosisThe process where white blood cells engulf and digest pathogens.
    InflammationA localised immune response characterised by redness, swelling, heat, and pain, recruiting immune cells to infection.
    Complement systemA set of plasma proteins that enhance phagocytosis, cause lysis of pathogens, and promote inflammation.
    CytokinesSignalling proteins released by immune cells that regulate inflammation and communication.

    Innate immunity provides the body’s first line of defence against pathogens. Unlike adaptive immunity, it does not rely on prior exposure and acts immediately upon infection. Innate immunity includes physical and chemical barriers, cellular responses such as phagocytosis, and soluble factors like the complement system. While non-specific, it is vital for preventing pathogen spread and activating the adaptive immune system. Without innate responses, adaptive immunity would be too slow to prevent serious damage.

    • Skin acts as a tough physical barrier, with keratinised cells resistant to entry.
    • Sebum and sweat lower skin pH, inhibiting microbial growth.
    • Mucous membranes trap microbes; cilia in the respiratory tract sweep them out.
    • Secretions (tears, saliva) contain lysozyme, an enzyme that breaks down bacterial cell walls.
    • Stomach acid destroys many ingested pathogens.

    🧠 Examiner Tip: When asked about innate immunity, don’t just list barriers β€” also explain how they prevent pathogen entry (mechanism).

    • Phagocytes (macrophages, neutrophils) engulf pathogens into phagosomes, fuse with lysosomes, and digest them.
    • Phagocytosis is enhanced by opsonins (molecules that coat pathogens for easier recognition).
    • Natural killer (NK) cells detect and destroy virus-infected or cancerous cells by releasing perforins.
    • Dendritic cells process antigens and present them to T cells, linking innate and adaptive immunity.
    • Apoptosis (programmed cell death) is triggered in infected cells to limit pathogen spread.

    🧬 IA Tips & Guidance: Students can observe phagocytosis using microscope slides or simulations with yeast cells and white blood cell analogues.

    • Damaged cells release histamine, causing vasodilation and increased blood flow.
    • Capillaries become permeable, allowing immune cells to enter tissues.
    • Symptoms: redness, heat, swelling, pain.
    • Cytokines recruit more immune cells, amplifying the response.
    • Fever (systemic inflammation) raises body temperature, slowing pathogen growth.

    🌐 EE Focus: An EE could investigate the role of inflammation in different infections β€” beneficial in localised infections but damaging in chronic diseases (e.g., autoimmune disorders).

    • Complement proteins form a cascade that:
      • Attracts immune cells (chemotaxis).
      • Opsonises pathogens for phagocytosis.
      • Forms membrane attack complexes (MAC) to lyse bacteria.
    • Cytokines act as chemical messengers, coordinating immune activity.
    • Interferons inhibit viral replication and activate NK cells.

    ❀️ CAS Link: Students could design an educational campaign explaining everyday ways innate immunity is supported β€” such as hygiene, diet, and vaccinations.

    🌍 Real-World Connection: Disorders of innate immunity, such as chronic granulomatous disease (failure of phagocytosis), show its importance. Innate immunity is also the target of therapies like interferon treatment in viral infections.

    • Dendritic cells and macrophages present antigens to T lymphocytes, activating adaptive immunity.
    • Innate responses slow pathogen spread, giving adaptive immunity time to develop.
    • Failure of innate mechanisms compromises adaptive immunity activation.

    πŸ” TOK Perspective: Innate immunity is β€œnon-specific,” but is it really? Pattern recognition receptors (PRRs) can identify classes of pathogens β€” showing that even innate responses involve categorisation. TOK issue: To what extent are our scientific categories (innate vs adaptive) oversimplifications?

    πŸ“ Paper 2: Expect questions describing barriers, phagocytosis, or inflammation. Data-based questions may involve interpreting graphs of fever response, or phagocytic activity. Use specific examples like lysozyme, histamine, or NK cells for higher marks.

  • TermDefinition
    Organ systemA group of organs working together to perform a major physiological function (e.g., digestive, circulatory).
    InterdependenceThe reliance of one organ system on another to maintain overall body function and homeostasis.
    Circulatory systemThe transport system delivering oxygen, nutrients, and hormones while removing waste products.
    Respiratory systemProvides oxygen for cellular respiration and removes carbon dioxide.
    Excretory systemRemoves metabolic wastes and regulates water and ion balance.
    IntegrationThe coordinated action of multiple organ systems working as a unified whole.

    No organ system in the body functions in isolation. Each depends on others for inputs, regulation, and waste removal, forming an integrated network that maintains survival. For example, the respiratory and circulatory systems cooperate to deliver oxygen, while the digestive and circulatory systems ensure nutrient distribution. This interdependence maintains homeostasis, supports energy production, and allows adaptation to environmental change. A failure in one system often cascades into dysfunction in others, highlighting the importance of integration for health.

    • The respiratory system supplies oxygen to the blood, while the circulatory system distributes it to tissues.
    • Removal of carbon dioxide depends on both β€” tissues release COβ‚‚ β†’ blood carries it β†’ lungs exhale it.
    • Gas exchange efficiency depends on circulation speed and haemoglobin capacity.
    • During exercise, respiratory rate and cardiac output increase simultaneously under nervous and endocrine control.
    • Disruption in one system (e.g., lung disease) reduces circulatory efficiency and vice versa.

    🧠 Examiner Tip: When describing interdependence, always state the two-way relationship β€” not just β€œlungs give oxygen,” but also how blood flow regulates gas exchange.

    • The digestive system breaks food into absorbable nutrients (glucose, amino acids, fatty acids).
    • These nutrients are absorbed into blood or lymph and transported by the circulatory system to cells.
    • Liver processes absorbed nutrients, regulating glucose and detoxifying harmful substances.
    • Circulation ensures constant delivery of fuel for cellular respiration in tissues.
    • Failure in digestion (e.g., malabsorption) leads to nutrient deficiencies despite healthy circulation.

    🧬 IA Tips & Guidance: An investigation could track blood glucose changes after carbohydrate intake, linking digestive absorption with circulatory transport.

    • The excretory system (mainly kidneys) filters blood, removing nitrogenous waste while balancing water and salts.
    • Circulatory system delivers blood to kidneys for filtration and reabsorbs needed substances.
    • Together, they maintain osmotic balance and blood pressure.
    • Hormones (ADH, aldosterone) regulate kidney function, showing endocrine integration.
    • Kidney failure leads to toxin buildup in blood, disrupting circulation and affecting all systems.

    🌐 EE Focus: An EE could investigate how organ system interdependence limits survival β€” for instance, studying how kidney disease impacts cardiovascular health.

    • Nervous system provides rapid communication and control of organ activity.
    • Endocrine system regulates slower, long-term processes through hormones.
    • Both systems coordinate other organs:
      • Nervous signals regulate heart rate, breathing rate, digestion.
      • Hormones (adrenaline, insulin) adjust energy availability and metabolism.
    • Hypothalamus and pituitary gland serve as the key link between neural and hormonal regulation.
    • Disruption in coordination causes systemic disorders (e.g., diabetes, chronic stress syndromes).

    ❀️ CAS Link: A CAS activity could involve creating educational posters or workshops for younger students, showing β€œbody systems as a team” β€” like players in a football match where each depends on the others.

    🌍 Real-World Connection: Organ transplants highlight interdependence β€” a new heart or kidney must integrate with circulatory, immune, and endocrine systems to function properly. Diseases like sepsis demonstrate how failure in one system rapidly disrupts others.

    • Muscles require oxygen and nutrients from circulation to contract.
    • Skeletal system provides structure and protection for organs while storing calcium needed for nerve/muscle function.
    • Movement depends on nervous system control (signals to muscles), endocrine signals (growth hormones, adrenaline), and circulatory delivery of energy.
    • Immune system relies on circulation to transport white blood cells, while lymphatic system overlaps with both immunity and circulation.
    • Integration across all systems ensures survival in dynamic environments.

    πŸ” TOK Perspective: The interdependence of organ systems challenges reductionist approaches. TOK issue: Can studying systems in isolation ever fully explain health, or is a holistic systems biology approach required to understand the body?

    πŸ“ Paper 2: Questions may involve explaining how two systems interact (e.g., respiratory + circulatory), analysing the role of nervous and endocrine systems in coordination, or predicting consequences of failure in one system. Data-based questions often show graphs of heart rate, ventilation, or hormone levels. Full marks require explicit explanation of how systems depend on each other.