SL 1.3 — Geometric Sequences, Series & Sigma Notation
Topic
Description
Geometric Sequences
Sequences where each term is multiplied by a constant ratio.
nth Term Formula
Formula that allows calculation of any term without listing previous ones.
Geometric Series
Sum of the first n terms of a geometric sequence.
Sigma Notation
Notation for expressing repeated multiplication-based sums efficiently.
Applications
Radioactive decay, population growth, investment growth, spread of epidemics.
1. Understanding Geometric Sequences
A geometric sequence is one where each term is obtained by multiplying the previous term by a constant ratio r.
If the first term is a, the sequence looks like:
a, ar, ar², ar³, …
Unlike arithmetic sequences (steady addition), geometric sequences model multiplicative growth or decay.
This makes them strongly connected to natural sciences, investment calculations, and spread-based phenomena.
🌍 Real-World Example:
Radioactive decay, bacterial reproduction, interest compounding in bank accounts, and viral spread all follow geometric patterns because each stage depends on a percentage of the previous one.
🔍 TOK Perspective:
Geometric growth can feel unintuitive. How do we reconcile mathematical predictions (e.g., exponential spread)
with human intuition, which usually expects linear changes?
2. The nth Term of a Geometric Sequence
The general formula for the nth term is:
uₙ = a r⁽ⁿ⁻¹⁾
This formula is crucial for predicting future values — especially in finance or population modelling.
Example:
Sequence: 3, 6, 12, 24, …
a = 3, r = 2
The 10th term = 3 × 2⁹ = 1536.
🧠 Examiner Tip:
When a question gives two terms like u₃ and u₇, divide the equations to eliminate a.
This directly gives the common ratio r.
🔬 Science Connection (Physics):
Many nuclear decay processes follow the relation Nₙ = N₀ rⁿ.
This is identical in structure to geometric sequences.
3. Geometric Series — Sum of First n Terms
A geometric series is the sum of the first n terms of a geometric sequence.
The formula is:
Sₙ = a (1 − rⁿ) / (1 − r), for r ≠ 1
If |r| < 1, the terms get smaller and the series converges.
If |r| > 1, the terms grow rapidly and the series increases without bound.
Example:
Find S₅ for 4, 2, 1, 0.5, 0.25, …
a = 4, r = 1/2
S₅ = 4(1 − (1/2)⁵) / (1 − 1/2) = 7.75.
📝 Paper 2 Strategy:
Geometric sums frequently appear in modelling questions (epidemics, population growth).
Always check whether the question requires:
the sum of the series (Sₙ), or
a prediction using uₙ.
4. Sigma Notation for Geometric Sums
Sigma notation lets us express geometric sums compactly:
Σ ( a r⁽ⁿ⁻¹⁾ ) from n = 1 to k
To evaluate such expressions, identify:
first term a
ratio r
number of terms k
⚗️ IA Tip:
If your IA studies anything that grows or decays (savings, infections, chemical reactions),
geometric models outperform arithmetic ones.
Justify your choice mathematically — this strengthens Criterion E (Reflection).
5. Real-Life Applications
Geometric sequences appear when change happens by multiplying rather than adding:
compound interest
epidemic spread (R₀ modelling)
radioactive decay
charging of capacitors
population growth
❤️ CAS Idea:
Collect school attendance or social media engagement over time.
Determine whether behaviour follows a geometric or arithmetic pattern,
and present the findings visually.
🔍 TOK Discussion:
A finite geometric area (like the classical paradox of the infinite perimeter enclosing a finite area)
raises questions:
Does mathematics reflect reality, or does reality conform to mathematical abstraction?
An arithmetic sequence is defined by a constant difference between consecutive terms.
If the first term is a and the common difference is d, the sequence looks like:
a, a + d, a + 2d, a + 3d, …
This constant difference makes arithmetic sequences one of the simplest models of steady change.
They are widely used in finance, population modelling, salary growth, and linear approximations in science.
🌍 Real-World Insight:
Many incomes increase by the same fixed amount every year rather than by percentage (e.g., +₹10,000 per year).
This makes real salaries closer to arithmetic sequences, not geometric ones.
🔍 TOK Perspective:
Why do humans find patterns so compelling?
Arithmetic sequences reflect our natural desire to see regularity — but in reality, almost no situation behaves perfectly linearly.
2. The nth Term Formula
The nth term tells us the value of any term in the sequence without manually generating earlier ones.
The formula is:
uₙ = a + (n − 1)d
Example:
Sequence: 7, 12, 17, 22, …
Here a = 7 and d = 5.
The 20th term is u₂₀ = 7 + 19×5 = 102.
🧠 Examiner Tip:
If a question gives two specific terms (like u₅ and u₁₂), always form two equations and solve simultaneously for a and d.
🌐 Historical Connection:
Indian mathematician Aryabhata described arithmetic progressions over 1500 years ago.
Ancient chess legends (e.g., Sissa ibn Dahir) also use structured numeric patterns that relate to sequence theory.
3. Arithmetic Series: Sum of the First n Terms
An arithmetic series is the sum of terms from an arithmetic sequence.
There are two equivalent formulas:
Sₙ = n/2 (2a + (n − 1)d) Sₙ = n/2 (a + uₙ)
The first version is useful when you know a and d.
The second is useful when you know the last term uₙ.
Example:
Find the sum of the first 50 terms of 4, 9, 14, 19…
a = 4, d = 5
S₅₀ = 50/2 × (2×4 + 49×5) = 25 × 253 = 6325.
📝 Paper 1 Tip:
If you see sigma notation Σ(3n + 7), rewrite it as an arithmetic sequence with a = 10 and d = 3, then use the series formula.
4. Sigma Notation (Σ)
Sigma notation expresses long sums compactly.
For example:
Most arithmetic-sum questions require identifying:
the first term a,
the common difference d,
the number of terms n.
🌍 Real-World Example:
Summing the number of tiles in a stepped architectural structure or calculating total savings with fixed yearly deposits
both naturally use arithmetic series and sigma notation.
5. Applications in Modelling & Prediction
Arithmetic sequences help model situations of steady linear growth.
Examples include:
simple interest accumulation
salary increments by fixed amounts
transport schedules
production planning
However, many real-life patterns aren’t perfectly linear —
so you may need to approximate a common difference or recognise when the arithmetic model breaks down.
⚗️ IA Tip:
If your IA investigates growth (finance, sports, population), try fitting both arithmetic and geometric models.
Comparing them can strengthen your Mathematical Communication marks.
🔍 TOK Discussion Embedded:
Is identifying a pattern the same as explaining it?
Arithmetic sequences describe behaviour — but do they cause it?
Consider also Fibonacci patterns and the golden ratio as contrasting nonlinear sequences.
2.5 ZONATION, SUCCESSION AND CHANGE IN ECOSYSTEMS
📌 Definitions Table
Term
Definition
Soil Horizons
Distinct layers of soil that differ in texture, structure, composition, and color, forming through processes like leaching and organic matter accumulation.
Moraines
Accumulations of glacial debris (rock and soil) deposited by moving glaciers, forming ridges or mounds in post-glacial landscapes.
Climax Community
A stable and self-sustaining ecosystem at the end of ecological succession, in dynamic equilibrium with its environment.
📌 Zonation
Zonation refers to the gradual change in the composition of species and communities across a landscape, based on a gradient of environmental factors such as:
Elevation (altitude)
Latitude
Tidal level
Soil horizons
Distance from water source
Temperature
Moisture
Light
As these factors change, the species present in an ecosystem also change
This leads to distinct zones or bands of organisms that can be observed in the ecosystem
This process occurs due to the interactions between the physical environment (abiotic factors) and the biological components (biotic factors) of an ecosystem
An example of zonation can be observed in a rocky intertidal zone
Here, the physical and biological characteristics of the ecosystem change gradually from the high tide mark to the low tide mark
At the highest point (sometimes referred to as the spray zone), the zone is usually dry and dominated by lichen and other hardy plants that can withstand long periods of exposure to air and sunlight
In the high tide zone, the environment becomes more hospitable for other organisms such as barnacles, mussels, chitons, limpets and sea snails that can attach themselves to the rocks and withstand waves
Further down towards the low tide zone, the environment becomes even more favourable for marine organisms such as sea stars, anemones, and sea urchins that require the constant presence of water
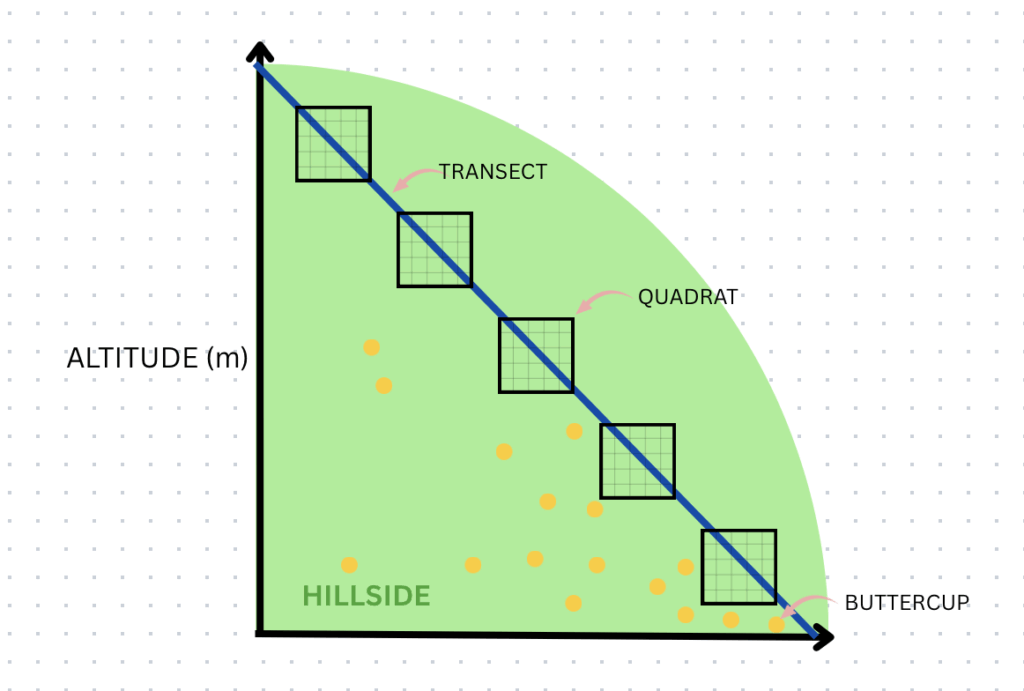
Representing results
The results of an investigation into the distribution and abundance of organisms can be represented visually using a type of graph known as a kite diagram
Kite diagrams can show both distribution and abundance
The distribution of a species along a transect can be shown by its position along a central horizontal line in each section of a kite diagram
Each section represents a different species
The distance along the transect is given on the x-axis, to which the horizontal line is parallel
The abundance of a species can be shown by the width of the ‘kite‘ around the central horizontal line
The shape is referred to as a kite because it extends an equal distance on each side of the central horizontal line
Additional sections can be added to a kite diagram to show the changes in abiotic factors at different points along a transect e.g. the height above sea level or the pH of soil
📌 Succession
Ecosystems are dynamic, meaning that they are constantly changing
Ecosystems change from being very simple to being relatively complex
This process is known as succession
During succession, the biotic conditions (i.e. the living factors) and the abiotic conditions (i.e. the non-living factors) change over time
Primary succession is the process that occurs when newly formed or newly exposed land (with no species present) is gradually colonised (inhabited) by an increasing number of species
This new uninhabited land can be created in several ways. For example:
The magma from erupting volcanoes cools and often leads to the formation of new rock surfaces or even new rocky islands in the sea
Another way new land can be exposed is by sea-level dropping or the drying up of a lake, leaving areas of bare rock
When glaciers retreat, they also leave bare rock or moraines
Primary succession does not only occur on bare rock—any barren terrain that is slowly being colonised by living species is undergoingsuccession. For example:
Sand dunes in coastal areas
Marram grasses are the pioneer species in these environments as they have deep roots to access water that other plants can’t reach
They are also able to tolerate the salty environment i.e. the high concentrations of sodium and calcium ions caused by sea spray
Secondary succession is a very similar process but happens on bare soil where there has been a pre-existing community, such as:
An agricultural field that has stopped being used
A forest area after an intense forest fire
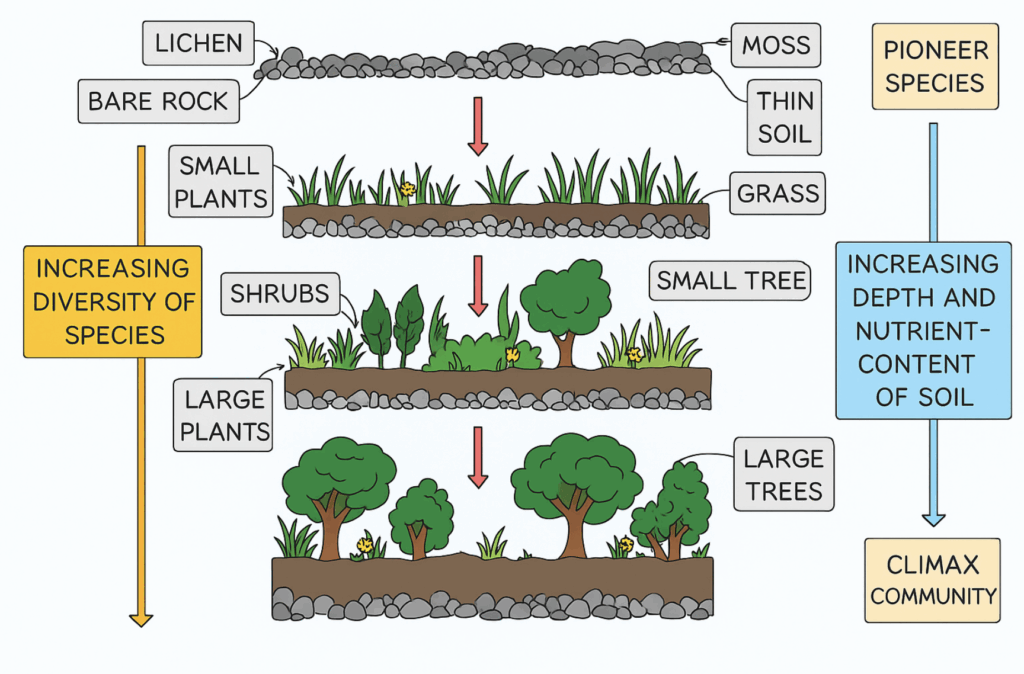
The stages of succession
A seral community (also known as a sere) is a temporary and intermediate stage in the ecological succession of an ecosystem
Each seral community, in succession, causes changes in environmental conditions
These changes allow the next community to replace it (e.g. through competition) until a stable climax community is reached
First, seeds and spores carried by the wind land on the exposed rock and start to grow
These first species to colonise the new land (often moss and lichens) are known as pioneer species
As these pioneer species die and decompose, the dead organic matter (humus) forms a basic soil
Seeds of small plants and grasses, sometimes also carried in the wind or transported other ways (e.g. in bird faeces), land on this basic soil and begin to grow (these smaller plants are adapted to survive in shallow, relatively nutrient-poor soils)
As these small plants and shrubs die and decompose, the new soil becomes deeper and more nutrient-rich
The roots of these small plants and shrubs also form a network that helps to hold the soil in place and prevent it from being washed away
Larger plants and shrubs, as well as small trees that require deeper, more nutrient-rich soil, can now begin to grow
These larger plants and small trees also require more water, which can be stored in deeper soils
Finally, the soil is sufficiently deep, contains enough nutrients and can hold enough water to support the growth of large trees
These final species to colonise the new land become the dominant species of the now relatively complex ecosystem
The final community formed, containing all the different plant and animal species that have now colonised the new land, is known as the climax community
🌐 EE Tip: Conduct a field-based EE on succession or species diversity in a local park, wetland, or urban green space.
Changes occurring during succession
As the the structure and species composition of an ecosystem changes during succession, so do the patterns of energy flow, productivity, species diversity and nutrient cycling that ecosystem
Energy flow:
During the early stages of succession, the energy flow in the ecosystem is relatively low
This is because there are only a few species present and most of the energy is used to build biomass
As the ecosystem becomes more complex, energy flow increases
Productivity:
During the early stages of succession, gross productivity and net productivity are low because there are only a few species present
This means the ecosystem’s overall gain in energy and biomass per unit area per unit time is relatively small
As the ecosystem becomes more complex, gross productivity and net productivity increase
Species diversity:
Diversity refers to the number of species present in an ecosystem
During the early stages of succession, diversity is low because there are only a few species present
As the ecosystem becomes more complex, diversity increases because there are more niches available
This means more species are able to coexist within the same habitats in the ecosystem
Nutrient cycling:
Nutrient cycling refers to the movement of nutrients through an ecosystem
During the early stages of succession, nutrient cycling is relatively simple
This is because there are only a few species present and abiotic processes dominate nutrient cycling
As the ecosystem becomes more complex, nutrient cycling becomes more complex
This is because there are more species present and each species has unique nutrient requirements and cycling processes
📌 Resilience and Stability of Ecosystems
Resilience & stability of ecosystems
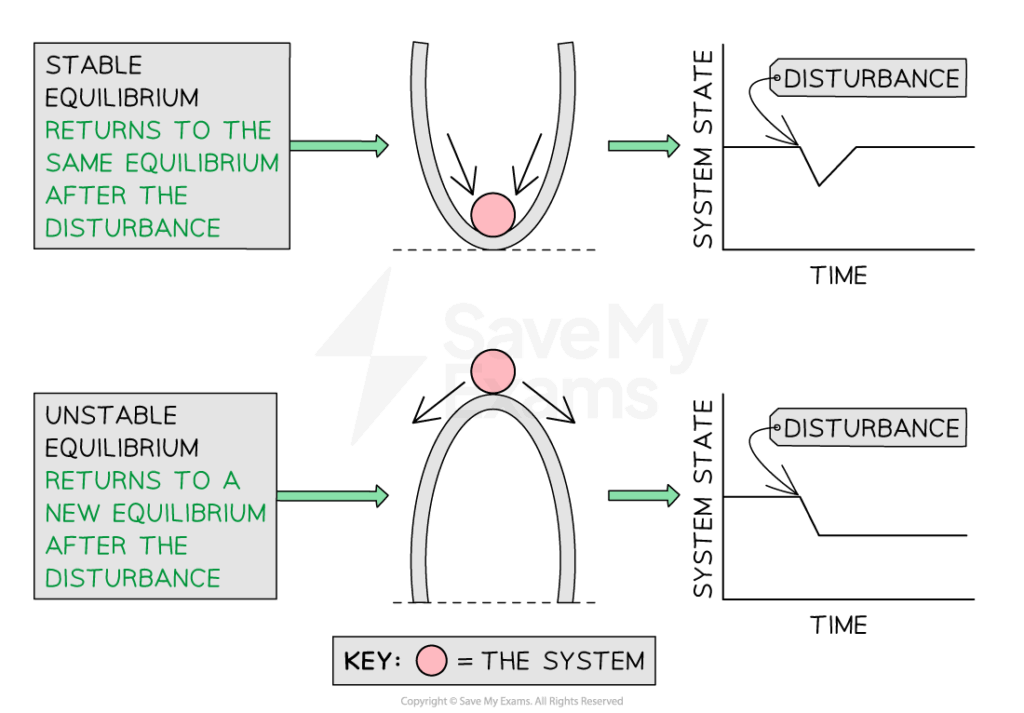
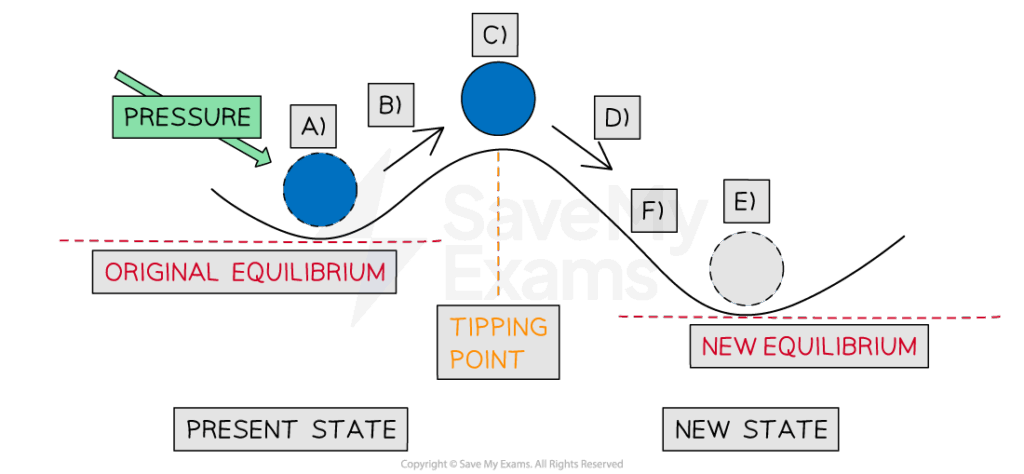
An ecosystem’s capacity to tolerate disturbances and maintain equilibrium depends on its diversity and resilience
Diversity refers to the variety of species, genetic variations, habitats and ecological functions within an ecosystem
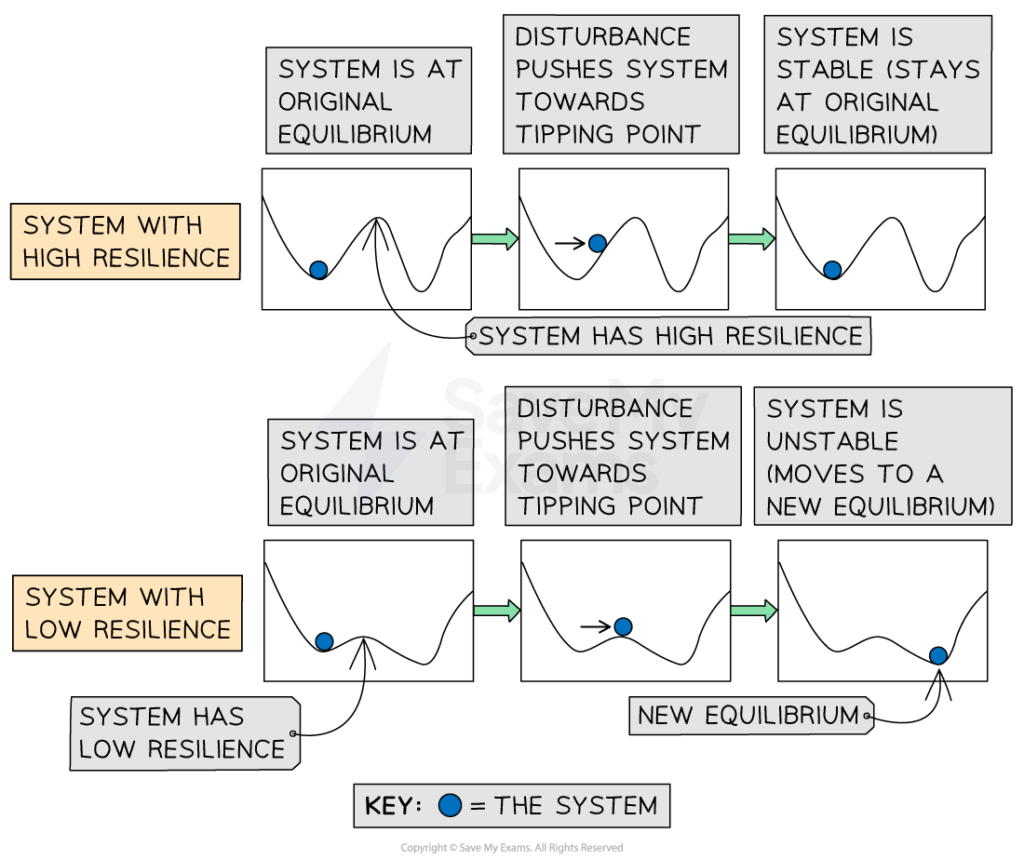
Resilience refers to the ability of an ecosystem to recover after a disturbance
High resilience = ecosystem quickly returns to its original state after disturbance
Low resilience = ecosystem takes a long time to recover or does not fully recover after disturbance
Greater diversity often means greater resilience—two main reasons for this include:
Species redundancy:
Multiple species perform similar roles, so if one species is lost, others can fill its ecological role
Genetic variation:
More genetic diversity within a species can help it adapt to changing conditions
🔍 TOK Tip: Can we ever fully measure ecosystem complexity?
Human impacts on succession
Human activities can divert the progression of succession to an alternative stable state by modifying the ecosystem through various activities, such as:
Burning
Agriculture
Grazing pressure
Resource use (such as deforestation)
These activities can have both direct and indirect impacts on the ecosystem
They lead to changes in the biotic and abiotic components, ultimately altering the course of ecological succession within the ecosystem
For example, controlled fires are often used to clear land for agricultural purposes or to manage the spread of wildfires
However, fire can have serious negative effects on the ecosystem by killing off plants, reducing soil fertility and altering nutrient cycles
Similarly, agriculture and grazing can cause soil erosion, loss of vegetation cover and changes in nutrient cycling
This can, in turn, affect the composition of the species in the ecosystem
These activities, which divert the progression of succession, may be temporary or permanent, depending upon the resilience of the ecosystem
If the human disturbance is mild and the ecosystem is highly resilient, it may be able to recover and return to its original state
If the disturbance is severe and the ecosystem is less resilient, the ecosystem will be permanently changed
This eventually leads to a new stable state with a different set of species and ecological interactions
This is one reason why it is so important to carefully consider the environmental impacts of human activities in order to minimise their negative effects on the ecosystem
It is essential to protect natural ecological processes, such as succession
2.4 CLIMATE AND BIOMES
📌 Definitions Table
Term
Definition (Exam-Ready, 2 Marks)
Limiting Factors
Environmental conditions that restrict the growth, distribution, or abundance of a population within an ecosystem.
Latitude
The distance north or south of the equator, influencing climate patterns such as temperature and insolation.
Precipitation
Any form of water (rain, snow, sleet, hail) that falls from the atmosphere to the Earth’s surface, affecting water availability in ecosystems.
Insolation
The amount of solar radiation received by a given area, influencing temperature and primary productivity.
🧠 Exam Tip: Link limiting factors to carrying capacity in longer responses, and latitude and insolation to biome distribution when possible.
📌 Weather and Climate
What is the difference between weather and climate?
Weather refers to the current state of the atmosphere at a specific time and place
Weather conditions can changerapidly (e.g. over just a few hours)
This includes short-term variations in:
Temperature
Humidity
Cloud cover
Precipitation
Wind speed
Air pressure
Other atmospheric conditions
Climate refers to the long-term average of weather conditions in a particular region or location
It describes the overall patterns, trends and variations in atmospheric factors (temperature, humidity etc.) over relatively long time periods
Climate is the average of these conditions over approximately 30 years or more
Climate is influenced by various factors such as solar radiation, atmospheric circulation patterns, ocean currents, land features and greenhouse gas concentrations
Climate provides a broader perspective on long-term atmospheric behaviour
Whereas, weather is more concerned with immediate atmospheric conditions and forecasts
Understanding the difference between climate and weather is crucial for:
Analysing long-term climate trends
Predicting short-term weather events
Assessing the impacts of climate change on weather patterns
📌 Biomes
What are biomes?
A biome is a group of similar ecosystems that have developed in similar climatic conditions
Biomes are large-scale ecological communities or ecosystem types
They are characterised by their dominant vegetation, climate and other abiotic factors
These factors shape their biotic communities
Biomes cover large geographic areas
Multiple ecosystems can be found within a single biome
Biomes can be categorised into groups including:
Freshwater biomes
Marine biomes
Forest biomes
Grassland biomes
Desert biomes
Tundra biomes
Each of these groups has characteristic abiotic limiting factors, productivity and biodiversity
These groups can be divided into further categories, for example:
Forest biomes are dominated by trees and can be further divided into:
Tropical rainforests
Temperateforests
Boreal forests
Grassland biomes are characterised by grasses and herbaceous plants and can be further divided into:
Savannas
Temperate grasslands
Desert biomes are characterised by low rainfall and are dominated by cacti and other drought-resistant plants—they can be further divided into:
Hot deserts
Cold deserts
Coastal deserts
Semi-arid deserts
Tundra biomes are found in high latitudes and are characterised by low temperatures and permafrost—they can be further divided:
Arctic tundra
Alpine tundra
Each biome has characteristic limiting factors that affect productivity and biodiversity
For example, in the desert biome, water is the limiting factor for plant growth, while in the tundra biome, low temperatures and permafrost limit plant growth
Forest Biomes
Characteristics
Tropical rainforest
Temperate forest
Boreal forest
Location
Low latitudesWithin Tropics: 23.5° north and south of equatorE.g. Amazon in South America, New Guinea, Southeast Asia, Zaire Basin
Between 40°–60° north and south of equatorE.g. Western Europe, northeast USA, Eastern Asia
Between 50°–60° north and south of equatorE.g. Canada, Russia, Scandinavia
Annual precipitation
Over 2000 mm
750–1500 mm (all year round)
300–900 mm (all year round)
Temperature range
26 to 28°C
Over 0° C in winter20 to 25°C in summer
-30°C in winterUp to 20°C in summer
Seasons
No seasons: hot and wet all year round
Four seasons of equal length
Two main seasons: winter and summer
Growing season
All year round
6–8 months
2–3 months
Soils
Relatively infertile due to leaching and rapid uptake of nutrients by plants
Relatively fertile and nutrient rich due to decomposition of organic matter over autumn and winter
Not very fertile: often acidic, with permafrostShallow soil with a thick litter layer due to slow decomposition
Biodiversity
Approx. 50% of world’s plant and animal species live within the rainforest biomeExample flora: mahogany, teak trees, lianas, orchidsExample fauna: Toucans, jaguars, frogs, snakes
Wide range of animals and plants with higher biodiversity than boreal forestsExample flora: deciduous trees e.g. beech, oak, birchExample fauna: deer, rabbits, squirrels, bears
Less biodiverse than temperate forestsExample flora: coniferous treesExample fauna: squirrels, bears, reindeer, wolves
Grassland Biomes
Characteristics
Savanna
Temperate grasslands
Location
5°–30° north and south of equatorNorth and south of tropical and monsoon forest biomesE.g. central Africa: Tanzania, Kenya
40°–60° north and south of equatorE.g.” veldts” of South Africa, “pampas” of Argentina, “steppes” of Russia, “plains” of USA
Annual precipitation
800–900 mm
250–750 mm
Temperature range
15–35°C
-40 to 40°C
Seasons
Wet and dry season
Four seasons
Growing season
During wet season (4–5 months)
During summer (dependent on temperature)
Soils
Free draining with thin layer of humusNot very fertile: most nutrients near the surface
Fertile soil
Biodiversity
Wide range of plant and animal speciesGreatest diversity of hoofed animalsGrasses, baobab and acacia treesZebras, elephants, giraffes
Large numbers of plant and animal speciesGrasses, sunflowersBison, antelopes, rabbits
Desert Biomes
Characteristics
Hot desert
Location
15°–30° north and south of equatorNorth Africa e.g. Sahara, Southern Africa e.g. Kalahari and Namib, Australia, Middle East
Annual precipitation
Below 250 mm
Temperature range
Daytime temperatures can reach 50°C but average around 25°CNight time temperatures below 0°C
Low biodiversitySmall grasses, mosses, lichenSnowy owls, snow bunting, tundra swanArctic foxes, hares and wolvesPolar bears, musk ox and caribou
The distribution of biomes
Insolation, precipitation and temperature are the main factors that determine where a biomes is located on Earth
Insolation refers to the amount of solar radiation that reaches the Earth’s surface
This affects temperature and the rate of photosynthesis in plants
Precipitation affects the availability of water
This is a key limiting factor for many biomes
Temperature determines the rate of photosynthesis and respiration in plants
It also affects the metabolic rates of animals
The combination of temperature and precipitation determines the distribution of biomes around the world
Effect of global warming on biomes
As the global climate changes, the distribution of biomes is shifting
This is leading to significant impacts on ecosystems and the services they provide
As climate conditions change, the boundaries of different biomes are moving
This is also causing changes in the plant and animal species that live there
Biome shifts can occur in two ways:
Range shifts—when species move to new areas to find suitable conditions as their current habitats become less hospitable
Biome type changes —when a biome transitions to a different type, such as a forest becoming a savanna or a tundra becoming a forest
The distribution of biomes is primarily determined by temperature and precipitation
As global temperatures rise due to global warming, the boundaries between biomes are shifting:
Poleward
Upward in elevation (i.e. to higher altitudes)
This means that the warmer biomes, such as tropical rainforests and savannas, are expanding, while the colder biomes, such as tundra and boreal forests, are contracting
The impacts of biome shifts are significant and far-reaching:
As species move to new areas or experience changes in their habitats, they may face new competition, predation, or disease
This can lead to declines in population numbers and even extinction in some cases
Biome shifts can also have impacts on the vital services that ecosystems provide to living organisms, especially humans, such as water regulation, nutrient cycling, and carbon sequestration
📌 Atmospheric Circulation and Ocean Currents
Global atmospheric circulation
Global atmospheric circulation can be described as the worldwide system of winds that move solar heat energy fromthe equator tothe poles to reach a balance in temperature
Wind formation
Air always moves from areas of higher pressure to lower pressure and this movement of air generates wind
Winds are large scale movements of air due to differences in air pressure
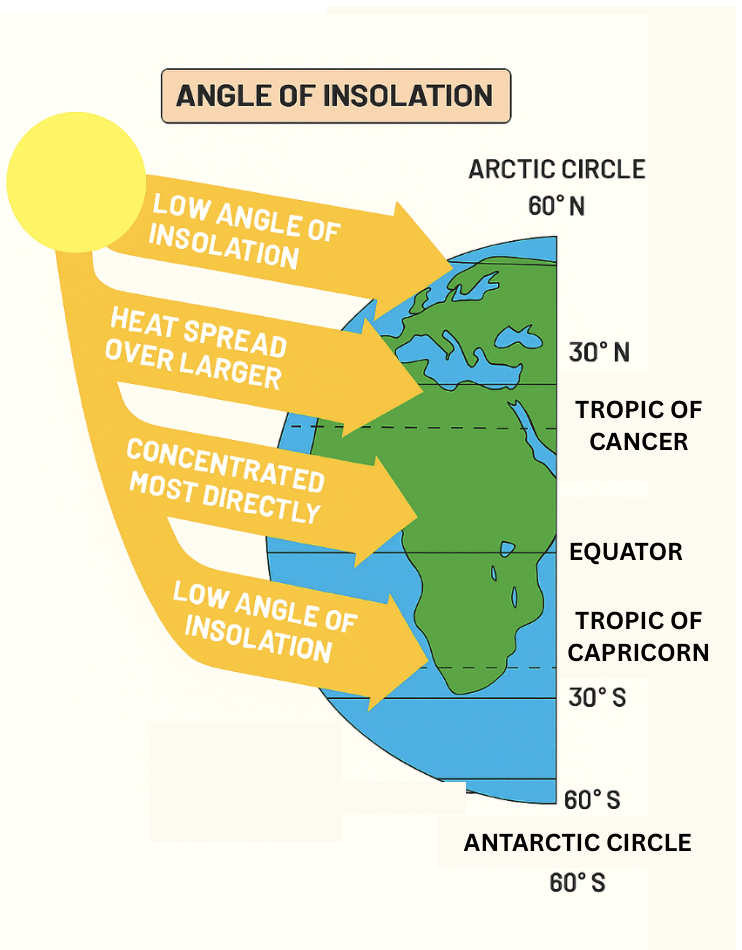
This pressure difference is because the Sun heats the Earth’s surface unevenly
Insolation that reaches the Earth’s surface is greater at the equator than at the poles
This is due to the Earth’s curvature and the angle of the Earth’s tilt
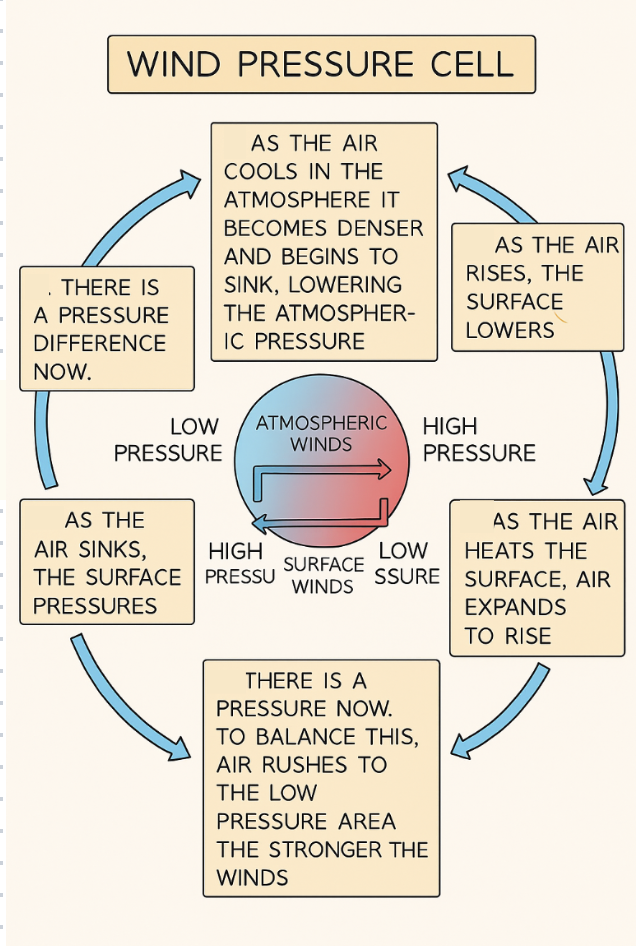
This irregular heating of the Earth’s surface creates pressure cells
In these pressure cells, hot air rises and cooler air sinks through the process of convection
Air movement within the cell is roughly circular and moves surplus heat from equatorial regions to other parts of the Earth
In both hemispheres (the Northern hemisphere and the Southern hemisphere), heat energy transfer occurs where different atmospheric circulation cells meet
There are three types of cell
Each cell generates different weather patterns
These are the Hadley, Ferrel and Polarcells
Together, these three cells make up the tricellular model of atmospheric circulation:
Image source: savemyexams.com
The tricellular atmospheric wind model
Each hemisphere has three cells (the Hadley cell, Ferrel cell and Polar cell) that circulate air from the surface, through the atmosphere, and back to the Earth’s surface again
The Hadleycell is the largestcell and extends from the equator to between 30° and 40° north and south
Trade winds blow from the tropical regions to the equator and travel in an easterly direction
Near the equator, the trade winds meet, and the hot air rises and forms thunderstorms (tropical rainstorms)
From the top of these storms, air flows towards higher latitudes, where it becomes cooler and sinks over subtropical regions
This brings dry, cloudless air, which is warmed by the Sun as it descends: the climate is warm and dry (hot deserts are usually found here)
The Ferrelcell is the middlecell, and generally occurs from the edge of the Hadley cell to between 60° and 70° north and south of the equator
This is the most complicated cell as it moves in the opposite direction from the Hadley and Polar cells; similar to a cog in a machine
Air in this cell joins the sinking air of the Hadley cell and travels at low heights to mid-latitudes where it rises along the border with the cold air of the Polar cell
This occurs around the mid-latitudes and accounts for frequent unsettled weather
The Polarcell is the smallest and weakest of the atmospheric cells. It extends from the edge of the Ferrel cell to the poles at 90° north and south
Air in these cells is cold and sinks creating high pressure over the highest latitudes
The cold air flows out towards the lower latitudes at the surface, where it is slightly warmed and rises to return at altitude to the poles
Influence on terrestrial biomes
The tricellular model influences the distribution of precipitation and temperature across latitudes
Near the equator, rising warm air leads to high rainfall and high temperatures
This creates tropical rainforests and savannas
Tropical rainforests thrive in regions of high precipitation and warmth within the Hadleycell
Mid-latitudes experience variable weather due to interactions between warm and cold air masses, resulting in temperate climates with moderate precipitation
This creates temperate forests and grasslands
These biomes occur in areas within the Ferrel cell, with moderate precipitation and temperatures
High latitudes, influenced by descending cold air, have low temperatures and limited precipitation
This creates polar deserts and tundra
These biomes occur due to the cold, dry conditions within the Polar cell
These climatic factors, in turn, influence the structure and productivity of terrestrial biomes by affecting plant growth, water availability and average temperatures
The tricellular model therefore helps us to:
Understand the global distribution of biomes
Understand the ecological characteristics of biomes
Predict biome shifts due to climate change and global warming
Ocean currents
Solar radiation absorption
Oceans act as vast heat reservoirs
This is because they absorb the solar radiation that penetrates their surface layers
Solar energy is absorbed primarily in the top layer of the ocean
Here, it warms the water and results in thermal energy being stored
Ocean currents and heat distribution
Ocean currents play an important role in distributing the heat absorbed by the oceans around the world
Surface ocean currents, driven by winds and Earth’s rotation, transport warm water from the equator towards the poles and cold water from the poles towards the equator
These currents redistribute heat horizontally across the ocean surface
This movement of heat affects regional climates and weather patterns
Impact on climate and ecosystems
The redistribution of heat by ocean currents helps regulate global climate
This is because it helps to moderate temperature extremes
Warm ocean currents can bring milder, warmer weather conditions to coastal regions, while cold currents cool down coastal regions
Oceanic heat transport also affects marine ecosystems
They affect patterns of ocean productivity, distributions of marine species and levels of marine biodiversity
2.3 BIOCHEMICAL CYCLES
📌 Definitions Table
Term
Definition (Exam-Ready, 2 Marks)
Storages
Components of a system where energy or matter is accumulated or held, such as biomass or soil nutrients.
Flows
Movements of energy or matter between storages in a system, either as transfers or transformations.
Biosphere
The global ecological system integrating all living organisms and their relationships with the atmosphere, hydrosphere, and lithosphere.
Residence Times
The average time a substance remains in a particular storage within a system before moving on.
Regenerative Agriculture
A farming approach that restores soil health, enhances biodiversity, and increases carbon sequestration while producing food.
Crop Rotation
The practice of growing different types of crops sequentially on the same land to maintain soil fertility and reduce pests.
Cover Cropping
Growing crops like legumes or grasses to cover soil between harvests, preventing erosion and improving soil health.
No-Till Farming
An agricultural method where the soil is not plowed, reducing disturbance, preserving structure, and preventing erosion.
Intensive Tillage
Frequent and deep plowing of soil for crop production, which can lead to soil degradation and loss of organic matter.
Monoculture Farming
The cultivation of a single crop species over a large area, often leading to reduced biodiversity and increased pest vulnerability.
Ocean Acidification
The lowering of ocean pH due to increased absorption of atmospheric CO₂, affecting marine organisms and ecosystems.
🧠 Examiner Tip:
For systems terms (storages, flows, residence times), include systems language (input, output, feedback).
For farming terms, always highlight impact on soil, biodiversity, or sustainability to show relevance to ESS.
📌 Biogeochemical Cycles
Biogeochemical cycles are natural processes that circulate the chemical elements necessary for life
They include cycles such as:
The carbon cycle
The nitrogen cycle
The hydrological cycle
These cycles ensure that these elements continue to be available to living organisms
This means they play a very important role in maintaining the balance of ecosystems and supporting life on Earth
Human impact
Human activities such as burning fossil fuels, deforestation, urbanisation and agriculture can disruptbiogeochemical cycles
This can lead to environmental imbalances and threaten the sustainability of ecosystems
For example, deforestation can disrupt the carbon cycle by reducing the number of trees available to absorb carbon dioxide from the atmosphere
Components of biogeochemical cycles
Biogeochemical cycles are made up of:
Stores
Sinks
Sources
Stores:
Also known as storages
They are “reservoirs” where elements are held for varying periods of time
They represent areas where the element remains in equilibrium with the environment i.e. the total input of the element is equal to the total output
Examples include oceans, atmosphere, soil and living organisms
For example, the ocean serves as a major store of carbon in the carbon cycle, with dissolved carbon dioxide being absorbed by seawater
At the same time, an equivalent amount of carbon dioxide is released back into the atmosphere, maintaining equilibrium
They can either be natural or artificial
Sinks:
Sinks represent parts of the cycle where a particular element accumulates over time
They are areas where the total input of the element is greaterthan the total output
This results in the net accumulation of the element
For example, fossil fuel deposits act as sinks for carbon in the carbon cycle, storing carbon that was once part of living organisms
They can either be natural or artificial
Sources:
Sources release elements into the cycle
They represent parts of the cycle where the total output of the element is greater than the total input
This results in net release of the element
For example, volcanic eruptions release large amounts of carbon dioxide into the atmosphere, acting as a source in the carbon cycle
They can either be natural or artificial
📌 Carbon Cycle
Many different materials cycle through the abiotic and biotic components of an ecosystem
All materials in the living world are recycled to provide the building blocks for future organisms
Elements such as carbon are not limitless resources
There is a finite amount of each element on the planet
Elements need to be recycled in order to allow new organisms to be made and grow
Carbon is constantly being recycled around the biosphere so that the total amount of carbon in the biosphere is essentially constant
Carbon is transferred from one form to another by the various processes in the carbon cycle
Organic and inorganic carbon stores
Organisms, crude oil and natural gas contain organic stores of carbon
Organic stores refer to the carbon-containing compounds found in organisms and fossil fuels
For example, carbon in these stores may exist as carbohydrates in organisms or hydrocarbons in fossil fuels
Inorganic stores exist in the atmosphere, soils and oceans
Inorganic stores refer to reservoirs of carbon that exist in other non-living components of the biosphere
For example, carbon in these stores may exist as carbon dioxide or carbonates
Equilibrium and residence time
A carbon store is in equilibrium when absorption (uptake) is balanced by the release
For example, the carbon stored in trees through photosynthesis is balanced by the carbon released during respiration
Residence time is the average time that a carbon atom remains in a store
Without human interference like mining, the residence time in fossil fuels would be measured in hundreds of millions of years
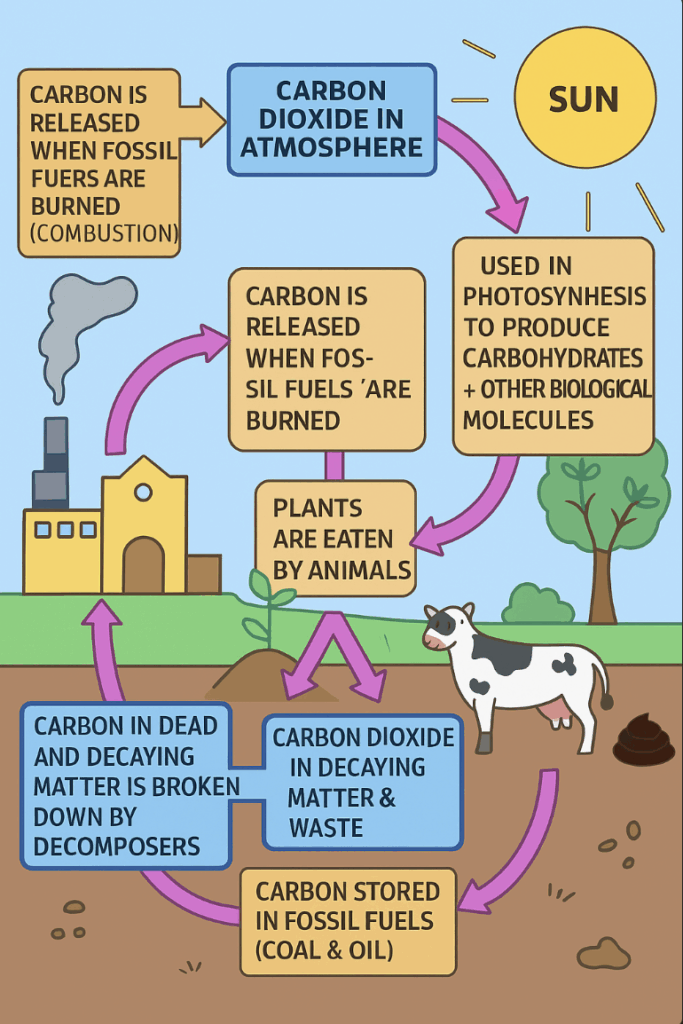
Carbon flows in ecosystems
Carbon flows between stores in ecosystems through various processes
The main processes include:
Photosynthesis (transformation)—plants absorb CO2 and convert it into organic compounds (carbohydrates)
Cellular respiration (transformation)—both plants and animals release CO2 during respiration
Feeding (transfer)—animals consume organic matter, transferring carbon through the food chain
Defecation (transfer)—carbon is returned to the soil through waste products
Death and decomposition (transfer)—decomposers break down dead organisms, releasing carbon back into the soil
Other processes include:
Fossilisation—if animals and plants die in conditions where decomposing microorganisms are not present, the carbon in their bodies can be converted, over millions of years and significant pressure, into fossil fuels such as peat and coal
Aquatic organisms that die also form sediments on the sea bedThese can go on to form other fossil fuels like oil and gas
Combustion—when fossil fuels are burned, the carbon locked within them combines with oxygen to form CO₂, which is released into the atmosphere
Carbon sequestration
Carbon sequestration is the process of capturing atmospheric CO2and storing it in solid or liquid forms
For example, trees naturally sequester carbon by absorbing CO2 during photosynthesis and storing it in their biomass
Organic matter can be fossilised over millions of years to form coal, oil and natural gas, resulting in carbon being stored underground
Ecosystems as stores, sinks or sources
Ecosystems can act as stores, sinks or sources of carbon depending on the balance between inputsand outputs
Net accumulation of carbon or net release of carbon is determined by the difference between total inputs and outputs
For example:
Young forest ecosystem: acts as a sink, as photosynthesis exceeds respiration, leading to net uptake of CO2
Mature forest ecosystem: acts as a store, with carbon cycling between living organisms, soil and atmosphere
Forest destruction (fire or deforestation): acts as a source, releasing stored carbon back into the atmosphere
📌 Human Impacts on the Carbon Cycle
Fossil fuels
Fossil fuels like coal, oil and natural gas are stores of carbon with virtually unlimited residence times
Fossil fuels were formed when past ecosystems acted as carbon sinks, trapping organic carbon over millions of years
They were created from ancient plants and animals that lived millions of years ago
Over time, their remains got buried deep underground
As they were buried, pressure and heat turned them into fossil fuels
Humans burn fossil fuels for energy production
When burned, these fuels release heat energy
The heat energy can be harnessed to generate electricity, power vehicles, heat buildings and fuel industrial processes
When burned, fossil fuels become carbon sources, releasing stored carbon back into the atmosphere as carbon dioxide
Agricultural systems
Agricultural systems can act as carbon sinks or carbon sources depending on the type of agricultural and the management techniques used:
Carbon sinks: regenerative agriculture techniques like crop rotation, cover cropping, and no-till farming result in soil acting as a carbon sink
This is because these methods increase the amount of organic matter in the soil
Carbon sources: drainage of wetlands, monoculture farming and intensive tillage result in soil acting as a carbon source
This is because these methods increase the release of carbon from soils
Longer-term cropping practices, such as timber production, also affect carbon cycling and storage in ecosystems
When forests are managed sustainably for timber production, they can act as significant carbon sinks
This is because they sequester carbon dioxide from the atmosphere through photosynthesis and store it in woody biomass and soil organic matter
However, if forests are clear-cut or managed unsustainably, they can become carbon sources
This is because stored carbon is released back into the atmosphere (when the harvested wood is burned) quicker than it is stored in new tree growth
Oceanic carbon dynamics
Carbon dioxide is absorbed into oceans by dissolving in sea water
It can also come out of the solution and is released as a gas when conditions change (e.g. when ocean temperature increases)
Normally, oceans act as a significant carbon sink, absorbing CO2 from the atmosphere and helping to regulate atmospheric carbon levels
However, the burning of fossil fuels by humans is releasing CO2 at a faster rate than oceans can absorb
This is leading to rising CO2 levels in the atmosphere
In addition to warming ocean temperatures caused by human-induced climate change, this is reducing the ability of oceans to act as carbon sinks
Ocean acidification
Increased concentrations of dissolved CO2 in oceans lowers the pH of the sea water, leading to ocean acidification
This is causing threats to marine organisms:
Small decreases in ocean pH reduce calcium carbonate deposition in mollusc shells and coral skeletons
This can lead to weakened shells, increased vulnerability to predators and smaller and less diverse reef structures
📌 Reducing Human Impacts on the Carbon Cycle
Human activities have significantly altered the carbon cycle
This has led to increased atmospheric carbon dioxide levels and climate change
Measures are urgently needed to reduce these impacts and restore balance to the carbon cycle
Example of these measure include:
Human activities have significantly altered the carbon cycle
This has led to increased atmospheric carbon dioxide levels and climate change
Measures are urgently needed to reduce these impacts and restore balance to the carbon cycle
Example of these measure include:
Low-carbon technologies:
Adopting low-carbon technologies is important for reducing carbon emissions from energy production, transportation, industry and buildings (heating, cooling etc.)
Examples include renewable energy sources like solar, wind and hydropower, as well as more energy-efficient technologies and practices (e.g. better insulation and heatpumps)
Reduction in fossil-fuel burning:
Decreasing the burning of fossil fuels is an essential step in reducing carbon emissions
Transitioning to cleaner energy sources, such as renewables can help achieve this
Using biomass as a fuel source:
Promoting sustainable cultivation of bioenergy crops that does not cause deforestation—bioenergy crops absorb carbon dioxide from the atmosphere as they photosynthesise
Utilising bioenergy with carbon capture and storage (BECCS) technology
This involves producing energy from biomass
The carbon dioxide emissions from biomass combustion are also captured and stored underground
Together these processes effectively remove carbon dioxide from the atmosphere
Reduction in soil disruption:
Decreasing soil disruption through sustainable agricultural practices is vital for preserving soil health and maintaining the ability of soils to sequester carbon
Practices such as crop rotation and cover cropping can minimise soil disturbance, erosion and loss of organic matter
Healthy soils with high organic carbon content act as carbon sinks, storing carbon and mitigating greenhouse gas emissions
Reduction in deforestation:
Implementing programs like the UN Collaborative Programme on Reducing Emissions from Deforestation and Forest Degradation in Developing Countries (UNREDD)
This prevents deforestation and promotes sustainable forest management
Carbon capture through reforestation:
Reforestation involves planting trees on deforested or degraded lands to sequester carbon from the atmosphere
Trees absorb CO2 during photosynthesis, storing carbon in their biomass and surrounding soils
Forests act as important carbon sinks
Artificial sequestration:
Artificial sequestration technologies capture CO2 emissions from industrial processes and power plants, preventing them from entering the atmosphere
Methods include carbon capture and storage (CCS), where CO2 is captured, transported and injected underground for long-term storage
Enhancing carbon dioxide absorption by the oceans:
Ocean fertilisation techniques involve adding compounds like nitrogen, phosphorus and iron to stimulate the growth of phytoplankton
These phytoplankton then absorb carbon dioxide through photosynthesis
Using methods to increase ocean upwellings
These upwellings bring nutrient-rich deep waters to the surface
This has the same effect of promoting the growth of phytoplankton and enhancing carbon dioxide absorption
2.2 ENERGY AND BIOMASS
📌 Definitions Table
Term
Definition
Photosynthesis
The process by which green plants convert carbon dioxide and water into glucose and oxygen using sunlight energy.
Autotrophs
Organisms that produce their own food from inorganic substances, typically through photosynthesis or chemosynthesis.
Aerobic Respiration
The process of breaking down glucose using oxygen to release energy, producing carbon dioxide and water.
Entropy
A measure of disorder or randomness in a system; it increases as energy is transformed and becomes less available for work.
Trophic Levels
Hierarchical levels in an ecosystem based on feeding positions, from producers to various levels of consumers.
Egestion
The removal of undigested food material from an organism’s body as waste.
Leach
The process by which water dissolves and carries away nutrients or contaminants from soil.
Primary Productivity
The rate at which producers convert solar energy into chemical energy (biomass) in an ecosystem.
Carbon Sink Capacity
The ability of a natural system, like a forest or ocean, to absorb and store atmospheric carbon dioxide.
Impervious Surfaces
Surfaces such as concrete or asphalt that prevent water infiltration into the soil, increasing runoff.
Heat Islands
Urban areas that are significantly warmer than surrounding rural areas due to human activities and impervious surfaces.
📌 Energy Flow in Ecosystems
Energy flow in ecosystems
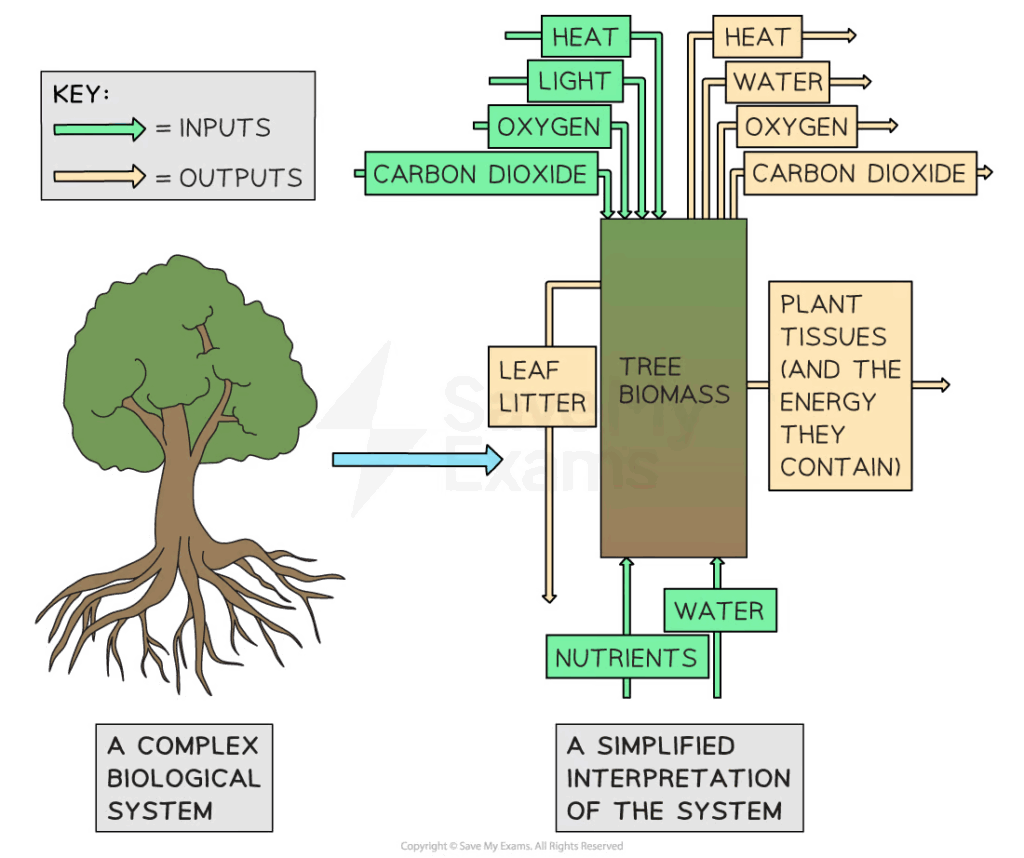
Ecosystems rely on a constant supply of energy and matter to maintain their structure and function
Energy is essential for driving biological processes, while matter cycles through the ecosystem, being reused and recycled
Ecosystems are considered open systems, meaning they exchange both energy and matter with their surroundings
Energy enters ecosystems primarily from the sun, entering as sunlight and being converted into chemical energy by producers through photosynthesis
This energy is then transferredbetween trophic levels as organisms consume one another, with some energy lost as heat at each transfer
Decomposers break down organic matter, releasing energy and returning nutrients to the environment
Matter, such as nutrients and water, flows into and out of ecosystems through various processes like decomposition, nutrient cycling and precipitation
The first law of thermodynamics
Energy exists in many different forms, including light energy, heat energy, chemical energy, electrical energy and kinetic energy
The way in which energy behaves within systems can be explained by the laws of thermodynamics
There are two laws of thermodynamics
The first law of thermodynamics is as follows:
Energy can neither be created nor destroyed, it can only be transformed from one form to another
This is also known as the principle of conservation of energy
It means that the energy entering a system equals the energy leaving it
It means that as energy flows through ecosystems, it can only change from one form to another
The transfer of energy in food chains within ecosystems demonstrates the principle of conservation of energy:
Energy enters the system (the food chain or food web) in the form of sunlight
Producers convert this light energy into biomass (stored chemical energy) via photosynthesis
This chemical energy is passed along the food chain, via consumers, as biomass
All energy ultimately leaves the food chain, food web or ecosystem as heat energy
The second law of thermodynamics
The second law of thermodynamics states that:
Energy transfers in ecosystems are inefficient
This is because energy transfers in any system are never 100% efficient
The second law of thermodynamics explains the decrease in available energy within ecosystems:
In a food chain, energy is transformed from a more concentrated (ordered) form (e.g. light energy from the Sun), into a more dispersed or disordered form (heat energy lost by organisms)
Initially, light energy from the Sun is absorbed by producers
However, even at this initial stage, energy absorption and transfer by producers is inefficient
This is due to reflection, transmission (light passing through leaves) and inefficient energy transfer during photosynthesis
The energy that is converted to plant biomass is then inefficiently transferred along the food chain due to respiration and the production of waste heat energy
In ecosystems, the biggest losses occur during cellular respiration
When energy is transformed, some must be degraded into a less useful form, such as heat
As a result of these inefficient energy transfers, food chains are often short (they rarely contain more than five trophic levels)
📌 Photosynthesis
What is photosynthesis?
Primary producers in the majority of ecosystems convert light energy into chemical energy in the process of photosynthesis
Producers are typically plants, algae and photosynthetic bacteria that produce their own foodusing photosynthesis
They are also known as autotrophs
Producers form the first trophic level in a food chain
The inputs and outputs are:
Inputs: sunlight as an energy source, carbon dioxide, and water
Processes: inside chloroplasts, chlorophyll captures certain visible wavelengths of sunlight energy and stores this as chemical energy
Outputs: glucose and oxygen
Transformations: light energy is transformed into stored chemical energy (in the form of glucose)
Photosynthesis produces the raw material for producing biomass
The glucose produced during photosynthesis is used as an energy source for the plant but also as the basic starting material for other organic molecules (e.g. cellulose and starch)
In ecosystems where sunlight and water are available, the process of photosynthesis enables plants to synthesise these organic compounds (glucose and other sugars) from carbon dioxide
Most of these sugars synthesised by plants are used by the plant as respiratory substrates
A respiratory substrate is a molecule (such as glucose) that can be used in respiration, to release energy for growth
📌 Respiration
Respiration is the conversion of organic matter into carbon dioxide and water in all living organisms, releasing energy
Cellular respiration releases energy from glucose by converting it into a chemical form that can easily be used in carrying out active processes ( such as growth and repair) within living cells
The aerobic respiration reaction is:
The inputs and outputs are:
Inputs: organic matter (glucose) and oxygen
Processes: oxidation processes inside cells
Outputs: release of energy for work (movement) and heat
Transformations: stored chemical energy is transformed into kinetic energy and heat
Some of the chemical energy released during cellular respiration is transformed into heat
Heat is generated by cellular respiration because it is not 100% efficient at transferring energy from substrates, such as carbohydrates, into the chemical form of energy used in cells
Heat generated within an individual organism cannot be transformed back into chemical energy and is ultimately lost from the body
The heat energy released increases the entropy in the ecosystem, following the second law of thermodynamics, while enabling organisms to maintain relatively low entropy (high organisation)
📌 Trophic levels and food chains
What are trophic levels?
The trophic level is the position that an organism occupies in a food chain (or food web)
If multiple organisms occupy the same position in a food chain, they are in the same trophic level
Trophic Level
Name of Trophic Level
Description of Organisms in Trophic Level
1
Producers
Plants and algae—produce their own biomass using energy from sunlight
2
Primary consumers
Herbivores—feed on producers
3
Secondary consumers
Predators—feed on primary consumers
4
Tertiary consumers
Predators—feed on secondary consumers
Producers are typically plants or algae and produce their own food using photosynthesis
They form the first trophic level in a food chain
The chemical energy stored in producers is then transferred to primary consumers as they consume(eat) producers
The chemical energy is then transferred from one consumer to the next as they eat one another
Consumers have diverse strategies for obtaining energy-containing carbon compounds
Type of Consumer
Description
Examples
Herbivores
Feed primarily on plants and plant-derived material
Deer: graze on grasses, leaves, and shrubsRabbits: consume grasses, herbs, and vegetables
Detritivores
Consume decomposing organic matter (detritus) and help break it down further
Earthworms: feed on decaying plant material and enhance soil structureDung beetles: consume animal dung, aiding in nutrient recycling
Predators
Hunt and consume other organisms (prey) for food
Lions: prey on various herbivores such as gazelles and zebrasWolves: hunt animals like deer and elk in packs
Parasites
Depend on a host organism for survival, often harming but not immediately killing it
Tapeworms: live in the intestines of mammals, absorbing nutrients from the host’s foodMosquitoes: feed on the blood of animals, including humans, for nourishment
Saprotrophs and decomposers
Saprotrophs: decompose dead organic matter externally and absorb nutrientsDecomposers: break down organic matter into simpler substances, playing a vital role in nutrient recycling
Fungi: break down dead plant material, such as fallen leaves and wood, into simpler compoundsBacteria: decompose organic matter, releasing nutrients for plant uptake
Scavengers
Consume dead animal carcasses, helping to clean up ecosystems
Vultures: feed on the remains of dead animals, scavenging carrionHyenas: opportunistic scavengers known to consume a wide range of animal remains
Food chains
Feeding relationships in ecosystems can be modelled using food chains
Because producers in ecosystems make their own carbon compounds by photosynthesis, they are at the start of food chains
Consumers obtain carbon compounds from producers or other consumers, so are placed in the higher trophic levels
In a food chain, carbon compounds and the energy they contain are passed from primary producers to primary consumers to secondary consumers, and so on
Apex predators are at the very top of the food chain—they are carnivores or omnivores with no predators
The chemical energy stored within apex predators can be passed on to decomposers when apex predators die and are decomposed
Traditionally, decomposers are not included in food chains as they gain carbon compounds from a variety of trophic levels
Image source: savemyexams.com
📌 Food Webs
A food web is a network of interconnected food chains
Food webs are more realistic ways of showing connections between organisms within an ecosystem as consumers rarely feed on just one type of food source
Compared to food chains, food webs give us a lot more information about the transfer of energy in an ecosystem
They also show interdependence (how a change in one population can affect others within the food web)
For example, in the food web above, if the population of earthworms decreased:
The population of grass plants would increase as there are now fewer species feeding off them
The populations of frogs and mice would decrease significantly as earthworms are their only food source
The population of sparrows would decrease slightly as they eat earthworms but also have another food source to rely on (caterpillars)
Image source: savemyexams.com
📌 Energy Losses in Food chains
Energy losses in food chains
The total organic matter transferred from one trophic level to the next is never 100% because:
Not all the food available to a given trophic level is harvested
Of what is harvested, not all is consumed
Of what is consumed, not all is absorbed
Of what is absorbed, not all is stored
For example, if we take the example of caterpillars (the primary consumer) eating the leaves of an oak tree (the producer):
The caterpillars do not eat every leaf available to them (there may simply be too many leaves, not enough caterpillars, or some leaves may be in locations that are difficult for the caterpillars to access)
The caterpillars may not eat the entire leaf (they might eat only the softer, more nutritious parts and leave behind tougher portions or parts with toxins)
Once the caterpillars eat the leaves, not all of the nutrients are absorbed by their bodies (some parts of the leaves may be indigestible or contain compounds that the caterpillars cannot process, which are then egested by the caterpillars)
When the caterpillars digest the leaves and convert the nutrients into energy, not all of the energy from the leaves is stored for growth and development, as some of that energy is lost as heat during cellular respiration
📌 Productivity and Biomass
Productivity
Gross productivity (GP) is the total gain in biomass by an organism or community in a given area or time period
It includes all the energy captured by organisms
E.g. by plants through photosynthesis or by consumers feeding on other organisms
For example, in a pond ecosystem, the total amount of energy captured by the aquatic plants and other species in the pond represents the gross productivity of that ecosystem
Net productivity (NP) is the amount of energy or biomass remaining after losses due to cellular respiration
These energy losses are subtracted from the gross productivity
Net productivity reflects the energy available for growth and reproduction
For example, if a plant has captured 1 000 kJ of energy through photosynthesis (gross productivity) but has used 300 kJ for cellular respiration, its net productivity would be 700 kJ
Losses due to cellular respiration are usually greater in consumers than in producers
This is due to the more energy-requiring activities of consumers
For example, herbivores need to spend energy on activities such as digestion and movement, resulting in higher respiratory losses compared to plants
Net productivity and sustainable yield
The NP of any organism or trophic level represents the maximum sustainable yield that can be harvested without decreasing the availability of resources for the future
To maintain ecosystem stability and biodiversity, it is important to avoid harvesting beyond the sustainable yield of populations
For example, in fisheries management, the sustainable yield of fish populations is determined by considering the net productivity of the fishery
Harvesting beyond the sustainable yield can lead to overexploitation and depletion of fish stocks
This affects both the ecosystem itself and human livelihoods
Measuring biomass
Estimating the biomass and energy of trophic levels in a community is an important step in understanding the structure and function of an ecosystem
There are several methods for measuring the biomass of a particular trophic, including:
Measurement of dry mass
Controlled combustion
Extrapolation from samples
Measurement of dry mass
One common method for estimating biomass is to measure the dry mass of organisms
This involves collecting samples of organisms from a particular trophic level and drying them in an oven to remove all water within the tissues
The dry weight of the sample is then measured
This can then be used to estimate the total biomass of the populations that have been sampled
Dry mass of samples is approximately equal to the mass of organic matter (biomass) since water represents the majority of inorganic matter in most organisms
For example:
If the dry mass of one daffodil plant is found to be 0.1 kg, then the dry mass (i.e. the biomass) of 200 daffodils would be 20 kg (0.1 x 200 = 20)
If the dry mass of the grass from 1 m² of a field is found to be 0.2 kg, we can say that the grass has a dry mass (i.e. biomass) of 0.2 kg m⁻² (this means 0.2 kg per square metre)
If the grass field is 200 m² in size, then the biomass of the whole field must be 40 kg (0.2 x 200 = 40)
Controlled combustion
Another method for estimating biomass is controlled combustion
This involves burning a known quantity of biomass and measuring the heat produced
By knowing the heat value of the biomass, it is possible to estimate the total biomass of a population or trophic level, based on the amount of heat produced
A piece of equipment known as a calorimeter is required for this process
The burning sample heats a known volume of water
The change in temperature of the water provides an estimate of the chemical energy the sample contains
Limitations of calorimetry
It can take a long time to fully dehydrate (dry out) a biological sample to find its dry mass
This is partly because the sample has to be heated at a relatively low temperature to ensure it doesn’t burn
Depending on the size of the sample, the drying process could take several days
Precise equipment is needed, which may not be available and can be very expensive
A very precise digital balance should be used to measure the mass of the sample as it is drying
This is to detect even extremely small changes in mass
It is preferable to use a very precise digital thermometer when measuring the temperature change of the water in the calorimeter
This is to detect even very small temperature changes
The more simple and basic the calorimeter, the less accurate the estimate will be for the chemical energy contained within the sample
This is due to heat energy from the burning sample being lost and not being transferred efficiently to the water
A bomb calorimeter ensures that almost all the heat energy from the burning sample is transferred to the water, giving a highly accurate estimate
📌 Ecological Pyramids
Ecological pyramids
Ecological pyramids include:
Pyramids of numbers
Pyramids of biomass
Pyramids of energy (also known as pyramids of productivity)
They are quantitative models usually measured for a given time and area
Pyramids of numbers
A pyramid of numbers shows how many organisms we are talking about at each level of a food chain
The width of the box indicates the number of organisms at that trophic level
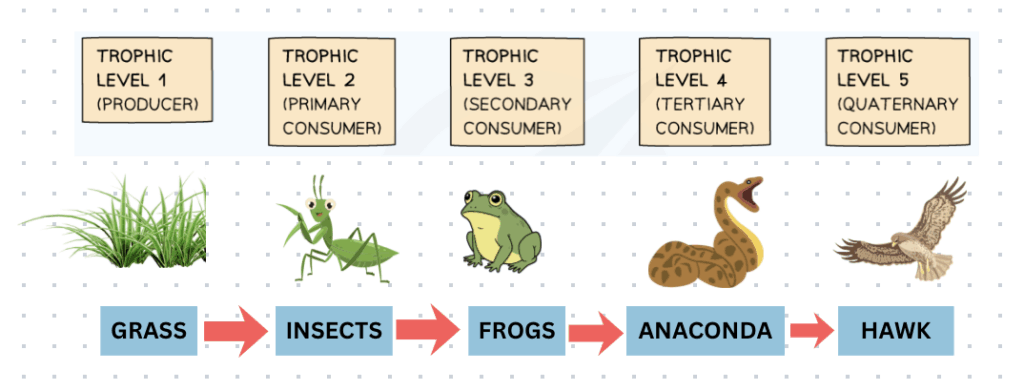
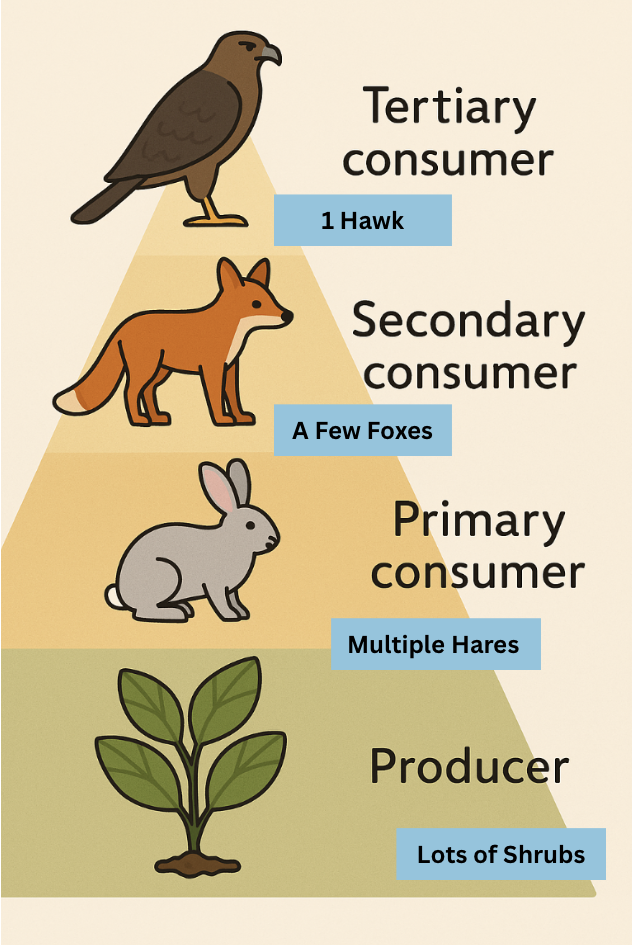
For example, consider the following food chain:
shrubs → hare → foxes → hawk
A pyramid of numbers for this food chain would look like the one shown below
Often, the number of organisms decreases along food chains, as there is a decrease in available energy since some energy is lost to the surrounding environment at each trophic level
Therefore pyramids of numbers usually become narrower towards the apex (the top)
Despite the name, a pyramid of numbers doesn’t always have to be pyramid-shaped
For example, consider the following food chain:
oak tree → insects → woodpecker
The pyramids of numbers for this food chain will display a different pattern to the first food chain
When individuals at lower trophic levels are relatively large, like the oak tree, the pyramid becomes inverted:
Only a single oak tree is needed to support large numbers of insects (which can then support large numbers of woodpeckers)
Image source: savemyexams.com
Pyramids of biomass
A pyramid of biomass shows how much mass the organisms at each trophic level would have without including all the water that is in the organisms:
This is known as their ‘dry mass’
As per the second law of thermodynamics, the quantities of biomass generally decrease along food chains, so the pyramids become narrower towards the top
If we take our first food chain as an example, it would be impossible to have 10kg of grass feeding 50kg of voles feeding 100kg of barn owls
Being able to construct accurate pyramids of biomass from appropriate data is an important skill
Pyramids of biomass are usually pyramid-shaped, regardless of what the pyramid of numbers for that food chain looks like
However, they can occasionally be inverted and show higher quantities at higher trophic levels
These inverted pyramids sometimes occur due to marked seasonal variations
For example, in some marine ecosystems, the standing crop of phytoplankton, the major producers, is lower than the mass of the primary consumers, such as zooplankton
This is because the phytoplankton reproduce very quickly and are constantly being consumed by the primary consumers, which leads to a lower standing crop but higher productivity
This can occur because phytoplankton can vary greatly in productivity (and therefore biomass) depending on sunlight intensity
Image source: savemyexams.com
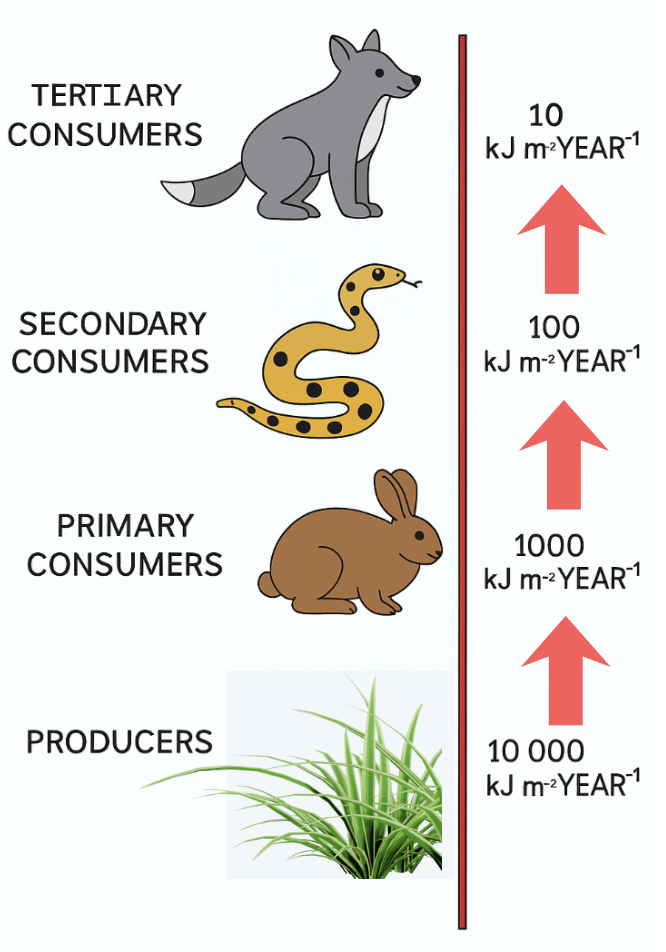
Pyramids of energy
Pyramids of energy (also referred to as pyramids of productivity) show the flow of energy through trophic levels, indicating the rate at which that energy is being generated
Pyramids of productivity illustrate the amount of energy or biomass of organisms at each trophic level per unit area per unit time
Productivity is measured in units of flow
The units are mass or energy per metre squared per year (g/kg m-2 yr-1 or J/kJ m-2 yr-1)
The length of each box, or bar, represents the quantity of energy present
These pyramids are always widest at the base and decrease in size as they go up
This is because pyramids of productivity for entire ecosystems over a year always show a decrease along the food chain, following the second law of thermodynamics
The base is wide due to the large amount of energy contained within the biomass of producers
As you move up the pyramid to higher trophic levels, the quantity of energy decreases as not all energy is transferred to the biomass of the next trophic level (roughly 10 % of the energy is passed on)
Energy is lost at each trophic level due to:
Incomplete consumption
Incomplete digestion
Loss of heat energy to the environment during respiration
Excretion of the waste products of metabolism e.g. carbon dioxide, water, and urea
📌 Human Impacts on energy and Matter flows
Bioaccumulation and biomagnification
Bioaccumulation is the build-up of persistent or non-biodegradablepollutants within an organism or trophic level because they cannot be broken down
Biomagnification is the increase in the concentration of persistent or non-biodegradable pollutants along a food chain
As pollutants are passed up the food chain from one trophic level to the next, they become more concentrated
This means that organisms at higher trophic levels (such as top predators) accumulate higher concentrations of pollutants than those at lower trophic levels
This is due to the decrease in the total biodegradable biomass of organisms at higher trophic levels
Pollutants that are persistent and non-biodegradable can accumulate along food chains
Examples include:
Polychlorinated biphenyl (PCB)
Dichlorodiphenyltrichloroethane (DDT)
Mercury
They can cause changes to ecosystems through the processes of bioaccumulation and biomagnification
For example, DDT was a widely used insecticide in the mid-20th century that was found to have harmful effects on birds of prey such as eagles and falcons
When DDT was sprayed on crops, it would leach into waterways and eventually enter freshwater and marine ecosystems
DDT would then enter food chains (via plankton) and accumulate in the bodies of fish
These fish would then be eaten by birds, which would accumulate higher concentrations of DDT
Because DDT is persistent and does not break down easily, it can continue to accumulate in the bodies of animals at higher trophic levels (such as birds of prey), leading to harmful effects such as thinning of eggshells and reduced reproductive success
Mercury is another example of a pollutant that can accumulate along food chains
Mercury is released into the environment through activities such as coal-fired power plants and gold mining
Once in the environment, mercury can be converted into a highly toxic form called methylmercury
This accumulates in the bodies of fish
As larger fish eat smaller fish, the concentration of methylmercury within the tissues of these fish increases, leading to potential harm for humans who eat large predatory fish such as tuna or swordfish
In 1956, for example, a chemical factory released toxic methylmercury into waste water entering Minamata Bay in Japan
Mercury accumulation in fish and shellfish caused mercury poisoning in local people (who ate the fish and shellfish) and resulted in severe symptoms (paralysis, death, or birth defects in newborns)
Non-biodegradable pollutants and microplastics
One concerning aspect of many non-biodegradable pollutants is that they can be absorbed by microplastics
This can increase the transmission of these pollutants within food chains (i.e. increase the level of biomagnification)
Microplastics are tiny plastic particles, often less than 5mm in size
They come from various sources like plastic bottles, packaging and synthetic clothing
When in the environment, these microplastics act a bit like sponges, absorbing non-biodegradable pollutants such as polychlorinated biphenyls (PCBs), pesticides and heavy metals such as lead and mercury
Effect on the food chain
Marine animals often ingest microplastics as they feed
As smaller organisms consume microplastics containing pollutants, these toxins accumulate in their bodies
Larger predators then consume these contaminated organisms, leading to biomagnification, where the concentration of toxins increases at higher trophic levels
This can have negative consequences for organisms in food chains
For example, a study found that oysters exposed to microplastics containing pollutants experienced:
Lower feeding rates
Altered growth patterns
Reduced reproductive success
This was found to negatively impact the fitness of individual oysters and the success of the population as a whole
Human activities and ecosystem impacts
Human activities can significantly change the natural flows of energy and matter within ecosystems
Burning fossil fuels:
Releases carbon dioxide into the atmosphere, contributing to global warming
Increased CO2 availability can increase photosynthesis rates
However, other pollutants and climate change effects (e.g. temperature rise and changing rainfall patterns) can outweigh this benefit, reducing primary productivity
For example, burning coal to generate electricity emits CO2 but also releases sulfur dioxide (SO2)
This pollutant contributes to acid rain and affects soil pH, which in turn impacts plant health and nutrient availability
This further reduces photosynthesis rates
Deforestation:
Clearing forests for agriculture, urbanisation, or logging disrupts ecosystems
As well as causing habitat loss and disruption of food webs, deforestation reduces the carbon sink capacity of forests
This contributes to climate change
Urbanisation:
Urban development replaces natural habitats with impervious surfaces like concrete, leading to increased runoff and reduced infiltration
Urban areas generate “heat islands”, increasing local temperatures
Agriculture:
Intensive agriculture involves the use of fertilisers, pesticides and monoculture practices
This can lead to soil degradation, water pollution and loss of biodiversity
2.1 INDIVIDUALS, POPULATIONS, COMMUNITIES, AND ECOSYTEMS
📌 Definitions Table
Term
Definition
Species
A group of organisms that can interbreed to produce fertile offspring.
Population
A group of organisms of the same species living in the same area at the same time.
Habitat
The physical environment or location in which a species normally lives.
Niche
The role and position a species has in its environment, including interactions and resource use.
Community
All populations of different species living and interacting in a common habitat.
Ecosystem
A community of organisms and their abiotic environment interacting as a system.
Biotic Factors
Living components of an ecosystem that affect other organisms (e.g., predation, competition).
Abiotic Factors
Non-living physical and chemical components of an ecosystem (e.g., temperature, pH, light).
Producer (Autotroph)
An organism that converts light or chemical energy into biomass through photosynthesis or chemosynthesis.
Consumer (Heterotroph)
An organism that obtains energy by feeding on other organisms.
Decomposer
Organisms (e.g., bacteria, fungi) that break down dead organic matter, recycling nutrients back into the ecosystem.
Trophic Level
The position an organism occupies in a food chain, based on feeding relationships.
Food Chain
A linear sequence showing the flow of energy from one organism to the next through feeding.
Food Web
A complex network of interlinked food chains showing energy flow within an ecosystem.
Biomass
The total mass of living or recently living organisms in a given area or trophic level.
Gross Primary Productivity (GPP)
The total amount of solar energy converted by producers into chemical energy through photosynthesis.
Net Primary Productivity (NPP)
The energy remaining after producers have used some through respiration (NPP = GPP − R).
Net Secondary Productivity (NSP)
The energy gained by consumers after respiration losses (NSP = GSP − R).
Respiration (R)
The process by which organisms convert glucose into usable energy, releasing CO₂ and water.
Photosynthesis
The process by which green plants use sunlight to convert CO₂ and water into glucose and oxygen.
Carrying Capacity
The maximum population size of a species that an environment can sustainably support.
Limiting Factor
A factor that restricts the growth or distribution of a population within an ecosystem.
Intraspecific Competition
Competition between individuals of the same species for resources.
Interspecific Competition
Competition between individuals of different species for shared resources.
Parasitism
A relationship where one organism (parasite) benefits at the expense of another (host).
Mutualism
A symbiotic relationship where both species benefit.
Succession
A natural process of change in ecosystem structure and species composition over time.
Zonation
Spatial variation in species distribution due to environmental gradients, such as altitude or salinity.
🧠 Exam Tips:
Use key terms like “interaction,” “energy flow,” “trophic,” “resources,” and “abiotic/biotic” where appropriate.
Include formulas where applicable (e.g., NPP = GPP − R) in productivity-related questions.
Always differentiate terms like population vs community or GPP vs NPP when both appear in the same question.
📌 Introduction to Ecological Systems
The biosphere
The biosphere refers to the narrow, life-supporting zone around the Earth
It is where the air (atmosphere), water (hydrosphere) and land (lithosphere) meet
The biosphere contains all living organisms, including:
Plants (flora)
Animals (fauna)
Fungi and microorganisms
It can be thought as one large, complex system of living communities, as well as their interactions with each other and with the non-living components of the Earth’s systems, all interacting as a single unit
Species
A species is a group of organisms sharing common characteristics that interbreed to produce fertile offspring
This is known as the biological species concept
Members of the same species share a gene pool, meaning that they can breed and produce offspring with similar traits
Populations
A population is a group of organisms of the same species living in the same area at the same time which interbreed
A population can be seen as an interbreeding unit of a species
One species may consist of any number of populations, from one to many—for example:
The Eastern Grey Kangaroo is a species of marsupial native to Australia
This species consists of multiple populations across various regions of Australia
There are populations of Eastern Grey Kangaroos in Queensland, New South Wales, Victoria and other parts of the country
Although individuals from these different populations are capable of interbreeding, in reality they very rarely do due to the fact that they are geographically isolated (separated) from each other
Each population may have its own unique characteristics and adaptations based on local factors such as habitat, climate and food availability
Despite being part of the same species, these populations may exhibit some small genetic and behavioural differences due to their isolation and local environmental conditions
Community
A community includes all of the different populations (of different species) living in the same area at the same time
A community is a collection of interacting populations within an ecosystem
For example, each species within a community depends on other species for food, shelter, pollination, seed dispersal, etc.
Habitat
A habitat is the local environment in which an organism, species, population or community normally lives
E.g. badgers, deer, oak trees and ants are all species that would live in a woodland habitat
A description of the habitat of a species can include both geographical and physical locations, as well as the type of ecosystem required to meet all environmental conditions needed for the survival of the organism, species, population or community
Ecosystems
An ecosystem refers to a community of living organisms, along with their physical environment, interacting as a system within a specific area
This includes the living, biotic components (such as plants, animals, fungi and microorganisms) interacting with the non-living, abiotic components (such as soil, water, air, sunlight, temperature, humidity and minerals)
These abiotic components provide the essential resources and conditions necessary for the survival and functioning of the biotic community
Together, the interactions between biotic and abiotic components shape the structure and dynamics of the ecosystem, influencing factors such as biodiversity, nutrient cycling and ecosystem services
Ecosystems vary in size, from small ponds to vast forests
Each ecosystem has its own unique characteristics, shaped by factors like geography, climate and the species present within it
Ecosystems are open systems in which both energy and matter can enter and exit. For example:
Photosynthetic organisms such as plants and algae capture sunlight, which is the primary source of energy for ecosystems
Energy exits ecosystems primarily through heat released during cellular respiration, lost during trophic transfers(e.g. from herbivores to carnivores) and radiated from the Earth’s surface into space
Matter can enter or exit ecosystems in the form of water, nutrients, gases or waste products produced by animals
📌 Classification and Taxonomic Tools
Classification
There are millions of different species that currently exist on Earth
Biologists and ecologists can manage and organise this enormous diversity of species by putting similar species together into groups
This process is known as classification
It involved organising and categorising species based on their similarities and differences
Species are grouped into a hierarchy of different categories according to the biological characteristics that they share
Classifying species in this way allows us to quickly identify them and predict their characteristics
Taxonomic Tools
Taxonomists use various tools to identify an organism and to help them decide how to classify it
Identification in this context means determining which species an individual organism belongs to
Comparison of specimens with reference collections
Taxonomists can compare unknown specimens with well-documented reference collections
These reference collections contain a large number of similar organisms that have already been identified and classified
This method involves physically comparing the specimen to known samples
It relies on the taxonomist’s expertise and the quality of the reference collection
For example, a botanist could identify an unknown plant specimen by visually comparing it with a large collection of known plant species at a botanical garden
Today there are apps that identify unknown species by comparing a photo to thousands of photos of different species in an online database (a virtual reference collection)
DNA surveys
DNA surveys involve analysing an organism’s DNA to determine its species
This method compares the DNA sequence of the specimen with known sequences from a very large number of species, stored in very large computer databases
It provides precise and reliable identification, especially for closely related species
For example, in a wildlife conservation project, researchers could use DNA surveys to distinguish between similar-looking species of butterflies
Dichotomous keys
Dichotomous keys are tools used to identify organisms based on their characteristics
The keys consist of a series of paired statements or questions with two possible answers
Each pair offers two choices, leading the user to another pair of statements or questions, eventually resulting in the identification of the organism
Below is an example of a dichotomous key that can be used to identify eight species in the Serengeti ecosystem:
1
a
Animal covered in black and white stripes
Zebra (Equus quagga)
b
Animal not covered in black and white stripes
go to 2
2
a
Animal is a large cat
go to 3
b
Animal is not a large cat
go to 4
3
a
Animal covered in spots
Cheetah (Acinonyx jubatus)
b
Animal not covered in spots
Lion (Panthera leo)
4
a
Animal has horns
go to 5
b
Animal does not have horns
go to 7
5
a
Horns meet in the middle of the head
Cape buffalo (Syncerus caffer)
b
Horns do not meet in the centre of the head
go to 6
6
a
Horns are long and curved
Grant’s gazelle (Nanger granti)
b
Horns are not long and curved
Oribi (Ourebia ourebi)
7
a
Animal has a long neck
Giraffe (Giraffa camelopardalis)
b
Animal does not have a long neck
African elephant (Loxodonta africana)
There are limitations to using a dichotomous identification key:
Limited scope:
Dichotomous keys are typically designed to identify a limited number of species and may not be comprehensive enough to identify all organisms in a given ecosystem
Inaccuracies:
Dichotomous keys are only as accurate as the information provided
If the key is not designed properly or lacks important distinguishing characteristics, the identification may be inaccurate
Variability:
Organisms can exhibit variability in their physical characteristics, which can make it difficult to accurately identify them using a dichotomous key
Time-consuming:
Using a dichotomous key can be a time-consuming process, especially for beginners who are not familiar with the organisms in question
Expertise required:
Dichotomous keys require a certain level of expertise and familiarity with the organisms in question
Beginners may find it difficult to use the key without assistance from an expert
Limited to physical characteristics:
Dichotomous keys are limited to the physical characteristics of organisms and may not take into account other important factors, such as behaviour or habitat, which can be important in identifying certain species
🔍 TOK Tip: To what extent can ecological models predict real-world outcomes?
📌 Factors Affecting Populations
Biotic & abiotic factors
Factors that determine the distribution of a population can be abiotic or biotic
Biotic refers to the living components of an ecosystem
Abiotic refers to non-living, physical factors that may influence organisms
Biotic factors
The living, biological factors that influence ecosystems and the communities of organisms within them are termed biotic factors
In other words, biotic factors are the interactions between the organisms within a population or community
Biotic factors include:
Predation
Herbivory
Parasitism
Mutualism
Disease
Competition
Examples of Biotic Factors
Biotic Factor
How it Affects Communities
Example
Availability of food
More food means organisms have a higher chance of surviving and reproducing. This means their populations can increase.
Rainforest ecosystems have a rich food supply and this allows many species to live there. Deserts have a poor food supply, which allows fewer species to live there.
New predators
In balanced ecosystems, predators catch enough prey to survive but not so many that they wipe out the prey population. If a new predator is introduced to the ecosystem, the system may become unbalanced.
Red foxes were introduced for recreational hunting in Australia in the 1800s but have since caused the decline of many native species that they feed on, such as small mammals and birds. This has also reduced the food supply for native predators.
New pathogens
If a new pathogen enters an ecosystem, the populations living there will have no immunity or resistance to it, and the population may decline or be wiped out.
Avian flu can cause population declines in wild bird species. An outbreak of the H5N1 virus in the bar-headed goose in Qinghai Lake, China, in 2005 caused the deaths of over 6 000 birds in the area, representing a significant proportion of the bar-headed goose population.
Competition
If two species compete for the same resource(s) and one is better adapted to take advantage of these resources, then that species will outcompete the other. This may continue until there are too few members of the less well-adapted species to breed successfully.
North American grey squirrels were introduced to the UK in the 1800s and have since caused a decline in our native red squirrel population. Grey squirrels have outcompeted red squirrels for resources such as food and nest-sites. They also carry a virus (a new pathogen) that red squirrels have no resistance to.
Abiotic factors
The non-living, physical factors that influence ecosystems and the communities of organisms within them are termed abiotic factors
These include factors such as:
Temperature
Sunlight
pH (soil and water)
Salinity
Dissolved oxygen
Soil texture
Moisture and precipitation levels
Minerals and nutrients
Wind intensity
Carbon dioxide levels (for plants)
Changes in abiotic factors can affect the survival and reproduction of organisms, and the overall functioning of ecosystems
Abiotic factors can be quantified (measured) to help determine the distribution of species in aquatic or terrestrial ecosystems
Examples of Abiotic Factors
Abiotic Factor
How it Affects Communities
Temperature
Affects the rate of photosynthesis in plants. It also affects the rate of metabolism, growth, and reproduction of organisms. Certain species have adapted to specific temperature ranges and cannot survive outside of those ranges.
Sunlight
Plants require light for photosynthesis. More light leads to an increase in the rate of photosynthesis and an increase in plant growth rates.
pH (soil and water)
pH levels affect the availability of nutrients in soil and water, influencing plant growth and the survival of aquatic organisms. Certain species are adapted to specific pH ranges.
Salinity
It affects the health and survival of aquatic organisms, particularly those that are adapted to specific salinity levels.
Dissolved oxygen
Essential for the survival of aquatic organisms, particularly fish. Low oxygen levels can lead to hypoxia and negatively impact aquatic ecosystems.
Soil texture
Influences water retention, nutrient availability, and root penetration, affecting plant growth and the distribution of soil-dwelling organisms.
Moisture and precipitation
Determines the amount of water available to organisms, which can impact their survival, growth, and reproduction.
Minerals and nutrients
Different species of plants are adapted to different soil mineral contents and nutrient concentrations, influencing plant growth and community composition.
Wind intensity
Wind speed affects the transpiration rate in plants and can disperse seeds and pollen, influencing plant distribution and reproduction.
Carbon dioxide levels
CO2 is required for photosynthesis in plants. CO2 concentration affects the rate of photosynthesis and overall plant growth.
Ecological niches
A niche describes the particular set of abiotic and biotic conditions and resources to which an organism or population responds and upon which an organism or population depends
Each individual species has its owndistinct niche because only one species can occupy a given niche.
If two species try to occupy the same niche, they will compete with each other for the same resources
One of the species will be more successful and out-compete the other species until only one species is left and the other is either forced to occupy a new, slightly different niche or to go extinct from the habitat or ecosystem altogether
For example, the three North American warbler species shown below all occupy the same habitat(spruces and other conifer trees) but occupy slightlydifferent niches as each species feeds at a different height within the trees
This avoids competition between the three species, allowing them to co-exist closely with each other in the same habitat
Population interactions
A population is a group of organisms of the same species living in the same area at the same time
Populations are characterised through:
Size
Density
Distribution
Age structure
Growth rate
Interaction with each other
Ecosystems consist of many populations of numerous different species interacting with each other
Populations interact in ecosystems through:
Herbivory
Predation
Parasitism
Mutualism
Disease
Competition
Resulting in ecological, behavioural and evolutionary consequences
Herbivory
When an organism (known as an herbivore) feeds on a plant
The carrying capacity of herbivore species is affected by the number of plants they feed on
An area with more plant resources will have a higher carrying capacity for herbivore species
This can have negative feedback effects (i.e. the carrying capacity of the herbivore species may decrease if herbivory rates are too high and the plant population decreases too much)
Predation
When one animal eats (preys upon) another
This lowers the carrying capacity of the prey species
This can also have negative feedback effects, lowering the carrying capacity of the predator species due to a decrease in prey numbers
In a stable community, the numbers of predators and prey rise and fall in cycles, limiting the carrying capacity of both predator and prey populations.
Mutualism
A mutualistic relationship between species is one in which both species benefit
This increases the carrying capacity of both species in the relationship
An example of a mutualistic relationship is the one that exists between bees and many species of flowering plants
Bees gain nectar (i.e. food to provide them with energy) from flowers
When bees visit flowers, pollen is transferred to their bodies
As bees visit multiple different flowers, they spread the pollen to these flowers, pollinating them
In this way, the flowers gain help in reproducing
Disease
Pathogens (bacteria, viruses, fungi, and protozoa) are organisms that cause diseases
These diseases lower the carrying capacity of the species that the pathogens infect
Changes in the incidence of diseases can cause populations to fluctuate around their carrying capacity
Competition
Competition can be divided into intraspecific competition (competition between members of the same species) and interspecific competition (competition between members of different species)
Intraspecific competition can lower the carrying capacity of a population due to a decrease in food availability caused by high population density
Interspecific competition occurs between species with similar niches, causing a decrease in the carrying capacity of one or both species
📌 Population Growth
Carrying capacity
The maximum stable population size of a species that an ecosystem can support (determined by competition for limited resources) is known as the carrying capacity
Every individual within a species population has the potential to reproduce and have offspring that will contribute to population growth
In reality, however, there are many abiotic and biotic factors that prevent every individual in a population from making it to adulthood and reproducing
This ensures the population size of each species is limited at some point (i.e. the carrying capacity of that species is reached)
This is why no single species has a population size that dominates all other species populations on Earth, with the exception of humans (as we have managed to overcome many of the abiotic and biotic factors that could potentially limit the population growth of our species)
Population size is regulated by density-dependent factors and negative feedback mechanisms
Density-independent factors may influence population size
For example, environmental conditions like climate, temperature, rainfall patterns and soil fertility can limit the size of a population
However, it is mainly density-dependentfactors that regulate populations around the carrying capacity
Density-dependent factors are factors whose impact on population size varies with the population’s density
Density-dependent factors
Competition for resources:
As population density increases, individuals compete more intensely for limited resources like food, water and shelter
For example, in a forest ecosystem, as deer population density rises, competition for available food (grass, leaves, etc.) increases, placing limits on individual growth rates and overall population size
Increased risk of predation:
Higher population density increases the likelihood of predators encountering prey, leading to more predation events
For example, in a coral reef ecosystem, as fish populations grow denser, predation by larger fish species also increases, regulating the population size of smaller fish species
Pathogen transmission:
Dense populations facilitate the spread of pathogens, such as diseases and parasites, leading to increased mortality rates
For example, in a population of bats living in a cave, as population density increases, close contact between individuals facilitates the transmission of pathogens—this increased pathogen transmission can lead to higher mortality rates among bats, regulating the population size
Negative feedback mechanisms
Density-dependent factors drive negative feedback mechanisms, which act to return a population to its equilibrium state, maintaining stability
As population density rises, factors like resource scarcity, increased predation and disease outbreaks trigger mechanisms that reduce population growth rates
Population growth curves
Population growth can either be exponential or limited by carrying capacity
If there are no limiting factors, population growth follows a J-curve (exponential growth)
When density-dependent limiting factors start to operate, the curve becomes S-shaped
J-curves
For some populations, when population growth is plotted against time, a J-curve is produced
A J-curve describes the growth pattern of a population in an environment with unlimited resources
The J-curve has three distinct phases:
Lag phase:
The initial growth is slow when the population is small
Exponential growth phase:
Population growth accelerates exponentially as the number of individuals increases
The curve takes a J-shape due to exponential growth, as resources are not limiting the growth of the population
The population will continue to grow until a limiting factor such as disease or predation occurs
Crash phase:
At this point, if there has been a significant population overshoot (if the population has increased far beyond the natural carrying capacity), there may be a sudden decrease in the population, known as a population crash
S-curves
For most populations, when population growth is plotted against time, an S-population curve is produced
An S-population curve describes the growth pattern of a population in a resource-limited environment
The S-population curve has four distinct phases:
Lag phase:
The initial growth is slow when the population is small
Exponential growth phase:
With low or reduced limiting factors, the population expands exponentially into the habitat
Transitional phase:
As the population grows, there is increased competition between individuals for the same limiting factors or resources
This competition results in a lower rate of population increase
Plateau phase:
The population reaches its carrying capacity and fluctuates around a set point determined by the limiting factors
Changes in limiting factors cause the population size to increase and decrease (these increases and decreases around the carrying capacity are controlled by negative feedback mechanisms)
📌 Human Populations
Limiting factors on human population growth
Human societies are increasingly able to overcome the limiting factors that once slowed down the growth of human populations
As well as allowing human population to dramatically increase in size in over the last few hundred years, this also has many negative consequences for the sustainability of ecosystems
The main reasons humans have been able to eliminate these limiting factors include:
Elimination of natural predators:
Removal of natural predators like wolves or big cats has led to unchecked growth in certain human populations
This has also resulted in imbalances in ecosystems, such as overgrazing by deer populations due to the absence of wolves
For example, in Yellowstone National Park, reintroduction of wolves helped control the elk population, which in turn allowed vegetation to regenerate and stabilised the ecosystem
Technological advances:
Technological advancements in agriculture and medicine have reduced mortality rates and increased food production
This has led to exponential population growth as more people survive and reproduce
The Green Revolution in the mid-20th century, with the introduction of high-yield crop varieties and modern agricultural techniques, significantly increased food production globally
Degradation of the environment:
Our degradation of the environment has allowed humans to extract valuable resources like timber, minerals and fossil fuels
Clearing of forests for agriculture and urbanisation provides more living space and land for food production, increasing human population growth rates
Environmental degradation continues to facilitate the extraction of energy sources, such as fossil fuels, which are vital for sustaining growing populations
However, these activities also disrupt ecosystems, leading to habitat destruction, pollution and resource depletion
Negative impacts on biodiversity and ecosystem services compromise the sustainability of ecosystems and eventually their ability to support human populations
Assessing carrying capacity for human populations
Scientists use various methods to estimate the carrying capacity of an environment for a given species
These methods include field observations, population surveys, mathematical modelling and data analysis
By studying population trends, resource availability and species interactions, researchers can make informed estimates of carrying capacity
However, estimating carrying capacity becomes challenging when it comes to human populationsdue to several reasons:
The broad and changing ecological niche of humans
Populations in ecosystems tend to reach equilibrium when the availability of resources matches the population’s needs
However, humans have a broad and dynamic ecological niche, constantly adapting through technological innovations and changes in consumption patterns
Mobility of resources:
Humans have the ability to move and exploit resources beyond their immediate habitat
This mobility complicates the assessment of carrying capacity, as humans can draw resources from distant locations
For example, global trade allows societies to access resources like food and materials from around the world, solving the problem of local resource limitations
Technological advancements:
Human societies have the ability to modify their environment and overcome traditional carrying capacity limitations through technology
For example, the development of agriculture and irrigation techniques has allowed humans to increase food production and support larger populations beyond what the natural environment could sustain
Cultural and social factors:
Human population dynamics are influenced by cultural norms, social behaviours and economic factors
For example, these can affect fertility rates and migration patterns, making it difficult to accurately predict or estimate carrying capacity for human populations
Changing lifestyles and consumption patterns:
Human populations are characterised by varying lifestyles and consumption rates, which can significantly impact resource demands and environmental impacts
For example, urbanised societies with high levels of consumption may strain the carrying capacity of their surrounding areas due to increased resource demands and waste generation
Adaptive capacity:
More so than any other species, humans have the ability to adapt and innovate in response to changing environmental conditions
This adaptability can affect carrying capacity by influencing resource use efficiency and the development of technological solutions
Disputed estimates of carrying capacity
Urbanisation and industrialisation continually reshape human habitats, making it challenging to estimate carrying capacity
Estimates are often disputed due to uncertainties in factors like technology, consumption patterns and environmental degradation
📌 Studying Populations
What is a population?
A population refers to the whole set of things that you are interested in
e.g. if a teacher wanted to know how long pupils in year 11 at their school spent revising each week then the population would be all the year 11 pupils at the school
Population does not necessarily refer to a number of people or animals
e.g. if an IT expert wanted to investigate the speed of mobile phones then the population would be all the different makes and models of mobile phones in the world
What is a sample?
A sample refers to a selected part (i.e. a subset) of the population that data is collected from
e.g. for the teacher investigating year 11 revision times, a sample would be a certain number of pupils from year 11
A random sample is where every item in the population has an equal chance of being selected
e.g. every pupil in year 11 would have the same chance of being selected for the teacher’s sample
A biased sample is where the sample is not random
e.g. the teacher asks pupils from just one class
What are the advantages and disadvantages of using a population?
You may see or hear the word census – this is when data is collected from every member of the whole population
The advantages of using a population include:
Accurate results – as every member/item of the population is used
All options/opinions/responses will be included in the results
The disadvantages of using a population include:
Time consuming to collect the data
Expensive due to the large numbers involved
Large amounts of data to organise and analyse
What are the advantages and disadvantages of using a sample?
The advantages of using a sample include:
Quicker to collect the data
Cheaper as not so much work involved
Less data to organise and analyse
The disadvantages of using a sample include:
A small sample size can lead to unreliable results
Sampling methods can usually be improved by taking a larger sample size
A sample can introduce bias
Particularly if the sample is not random
A sample might not be representative of the population
Only a selection of options/opinions/responses might be accounted for
The members/items used in the sample may all have similar responses
e.g. even with a random sample, it may be possible that the teacher happens to select pupils for their sample who all happen to do very little revision
It is important to recognise that different samples (from the same population) may produce different results
There are two different types of sampling:
Random
Systematic
In random sampling, the positions of the sampling points are completely random or due to chance
For example, sampling points can be selected using a random number generator to create a set of random coordinates
This method is beneficial because it means there will be no bias by the person who is carrying out the sampling that may affect the results (i.e. there will be no researcher bias)
Random sampling can be used when the population size or the individual sample size is relatively small, and all individuals have an equal chance of being sampled
In systematic sampling, the positions of the sampling points are chosen by the person carrying out the sampling and a regular pattern is used to select sample points
There is a possibility that the person choosing could show bias towards or against certain areas
Individuals may deliberately place the quadrats in areas with the least species as these will be easier and quicker to count
This is unrepresentative of the whole area
When a sampling area is reasonably uniform or has no clear pattern to the way the species are distributed, random sampling is the best choice
Transect sampling
Systematic sampling allows researchers to investigate the effect of the presence of certain environmental features on species distribution e.g. by taking samples along a line that extends away from, or along, an environmental feature, such as a river
A line of this type is known as a transect
Transect sampling is used when there is a clear change in the physical conditions across the area being studied
For example, there may be changes in altitude, soil pH or light intensity
Methods using transects can help show how species distribution changes with the different physical conditions in the area
A transect is a line represented by a measuring tape, along which samples are taken
For a line transect:
Lay out a measuring tape in a straight line across the sample area
At equal distances along the tape, record the identity of the organisms that touch the line (e.g. every 2 m)
For a belt transect:
Place quadrats at regular intervals along the tape and record the abundance or percentage cover of each species within each quadratA line transect and belt transect is carried out in a habitat
Quadrat sampling
Quadrats are square frames made of wood or wire
They can be a variety of sizes e.g. 0.25 m2 or 1 m2
They are placed on the ground and the organisms within them are recorded
Non-motile organisms such as plant species are commonly studied using random quadrat sampling to estimate their population size
Quadrats can be used to estimate population size by recording:
The number of an individual species: the total number of individuals of a single species (e.g. daisies) is recorded
Percentage cover: the approximate percentage of the quadrat area in which an individual species is found is recorded (this method is often used when it is difficult to count individuals of the plant species being recorded eg. grass or moss)
Estimating percentage cover and percentage frequency
Percentage cover is an estimate of the area within a given quadrat covered by the plant or animal being sampled
Percentage frequency is the number of squares in which the species occurs divided by the number of possible occurrences
% frequency = (number of quadrat squares in which species present ÷ total number of quadrat squares) × 100
This can be useful, as it can sometimes be difficult to count individual plants or organisms within a quadrat
For example, if grass is found in 89 out of 100 squares in the quadrat then it has a percentage frequency of 89%
This process could be repeated for a series of quadrats within a given sample area
This information could then be used to calculate the average percentage cover across all the sampled quadrats
Capture–mark–release–recapture & the Lincoln index
The sampling methods described above are only useful for non-motile (sessile) organisms
Different methods are required for estimating the number of individuals in a population of motile animals (i.e. animals that are mobile)
The capture-mark-release-recapture method is commonly used alongside the Lincoln index (a statistical measure used to estimate population size)
The Lincoln index can be used to estimate the abundance or population size of a species in a given area
First, the capture-mark-release-recapture technique is carried out
For a single species in the area:
The first large sample is taken—as many individuals as possible are caught, counted and markedin a way that won’t affect their survival e.g. if studying a species of beetle, a small amount of brightly coloured non-toxic paint can be applied to their carapace (shell)
The marked individuals are returned to their habitat and allowed to randomly mix with the rest of the population
When a sufficient amount of time has passed another large sample is captured
The number of marked and unmarked individuals within the sample are counted
The proportion of marked to unmarked individuals is used to calculate an estimate of the population size (the Lincoln index)
The formula for calculating the Lincoln index is:
Population size estimate = (M × N) ÷ R
Where:
M = number of individuals caught in the first sample (i.e. number of marked individuals released)
N = number of marked and unmarked individuals caught in the second sample (i.e. total number of individuals recaptured)
R = number of marked individuals in the second sample (i.e. number of marked individuals recaptured)
Limitations of using the capture-mark-release-recapture method
When using the mark-release-capture method, there are a few assumptions that have to be made:
The marked individuals must be given sufficient time to disperse and mix back in fully with the main population – this can be time-consuming
The marking doesn’t affect the survival rates of the marked individuals (e.g. doesn’t make them more visible and therefore more likely to be predated)
The marking remains visible throughout the sampling and doesn’t rub off – this is often difficult to ensure and so the accuracy of population size estimates may be negatively affected
The population stays the same size during the study period (i.e. there are no significant changes in population size due to births and deaths and there are no migrations into or out of the main population) – again, this is almost impossible to ensure, further affecting the accuracy of population size estimates
📌 Ecosystem Functioning and Sustainability
Sustainability of ecosystems
Sustainability is a fundamental property of ecosystems
It refers to the ecosystem’s ability to maintain balance and productivity over time
Ecosystems naturally regulate themselves to sustain life within them
Balanced inputs and outputs
In a steady-state ecosystem, inputs and outputs are balanced
Inputs include energy, nutrients and water entering the ecosystem
Outputs include energy, nutrients and waste leaving the ecosystem
This balance ensures the ecosystem’s long-term stability and resilience
These inputs and outputs can be illustrated with ecosystem flow diagrams
Flow diagrams demonstrate the movement of energy and nutrients within ecosystems
These diagrams highlight the interconnectedness of biotic and abiotic factors within an ecosystem
Evidence of long-term sustainability
Some ecosystems have persisted for millions of years, indicating their long-term resilience and sustainability
Tropical rainforests are a prime example of long-term sustainable ecosystems
Despite changes in climate and other external factors, these ecosystems have endured
For example, the Amazon Rainforest has remained stable despite external pressures like deforestation
Its great biodiversity and complex interactions contribute to its resilience
Human impacts on ecosystem stability
Human activity can disrupt the stability of ecosystems, leading to tipping points
Tipping points are critical thresholds where small changes can trigger significant shifts in the ecosystem
These shifts can lead to the collapse of the original ecosystem and the establishment of a new equilibrium
❤️ CAS Tip: Volunteer with a conservation NGO or wildlife group monitoring local biodiversity.
Deforestation in the Amazon Rainforest
Deforestation involves the clearing of trees for agriculture, logging, or urban development
Deforestation reduces the generation of water vapour by plants through transpiration
Impact on climate:
Reduced transpiration leads to a decrease in the amount of water vapour in the local atmosphere
Water vapour is essential for cloud formation and precipitation (which generates a significantcooling effect) and for maintaining regional climate patterns
Consequently, deforestation disrupts local and regional climate systems
Feedback loop:
Deforestation can create a positive feedback loop where reduced precipitation leads to further forest loss
With less precipitation, the remaining forest may become more susceptible to drought and wildfires, accelerating deforestation and, as a result, generating even less transpiration and water vapour for precipitation
New equilibrium:
If deforestation continues at its current rate, it may not be long until the Amazon Rainforest reaches a new equilibrium state
This new equilibrium may feature different compositions of species, reduced biodiversity and very different climate patterns
Understanding the role of keystone species
Keystone species are organisms within an ecosystem that have a disproportionately large impact on the structure and function of the ecosystem relative to their abundance
In other words, even if they have a relatively low abundance, keystone species play critical roles in maintaining the health and long-term stability of ecosystems
Image source: savemyexams.comThe presence of keystone species can help regulate the population sizes of other species and maintain higher levels of biodiversity
The removal of keystone species can have cascading effects throughout the ecosystem, leading to significant changes in community structure and function
If their removal disrupts the ecological balance too much, this can increase the risk of ecosystem collapse
Examples of keystone species
Purple sea stars (Pisaster ochraceus) play a crucial role in controlling mussel populations along the rocky shores of the North Pacific coast
Sea stars prey on mussels, preventing them from overwhelming the ecosystem
Without sea stars, mussel populations would expand rapidly and start to dominate the ecosystem, outcompeting other species for space and resources
This would displace other intertidal organisms, leading to a decline in overall species diversity
African elephants (Loxodonta africana) play a vital role in shaping the structure and composition of savannah grasslands
Elephants feed on shrubs and trees, preventing them from becoming too dense and dominating the landscape
Their browsing behaviour creates gaps in the vegetation, promoting the growth of grasses and increasing habitat diversity—this provides habitats for a greater variety of species, increasing species diversity
Their movement and feeding activities also contributes to soil nutrient cycling by redistributing nutrients and increasing soil fertility and plant growth
Human impacts on biosphere integrity
The planetary boundaries model identifies nine key Earth system processes essential for maintaining a stable planet
These boundaries represent safe operating limits for human activity to prevent irreversible environmental changes
Changes beyond these boundaries can lead to detrimental effects on Earth’s systems and human well-being
Biosphere integrity (one of the nine critical processes) refers to the overall health and diversity of life on Earth
Human activity has significantly impacted biosphere integrity, pushing it beyond critical thresholds
Disturbances to ecosystems have led to severe loss of biodiversity, disrupting ecological balance and resilience
Ecosystems and species diversity are highly interlinked, with each depending on the other:
Healthy ecosystems support diverse species populations, while diverse communities contribute to ecosystem resilience and stability
Loss of biodiversity due to human activities undermines the integrity of ecosystems, making them more vulnerable to collapse
Evidence from extinction rates
Extinction rates provide tangible evidence that the planetary boundary for biosphere integrity has been crossed
Highly accelerated rates of species extinction in recent times indicate severe disturbances to ecosystems and loss of biodiversity
Human-induced factors such as habitat destruction, pollution and climate change have driven extinction rates to unprecedented levels
Avoiding critical tipping points
Reversing the loss or “erosion” of biosphere integrity is crucial to preventing catastrophic shifts in Earth’s ecosystems
Addressing ecosystem damage and species loss is essential to avoiding reaching these critical tipping points
Ecosystem conservation efforts aim to preserve the structure, function and diversity of ecosystems
By protecting ecosystems, we can slow the rate of ecosystem damage and reduce the risk of irreversible changes
Preserving species is a key factor in maintaining ecosystem integrity
Each species occupies a unique ecological niche within an ecosystem, contributing to its stability and resilience
Protecting ecosystems helps to preserve the niche requirements essential for the ongoing survival of individual species
Various conservation strategies can help to protect ecosystems and preserve species diversity, including:
Habitat conservation: protecting natural habitats from destruction and fragmentation helps maintain ecosystem integrity
Species conservation: using specific methods to protect the most endangered species is essential for biodiversity conservation
Sustainable resource management: promoting sustainable practices ensures the responsible use of natural resources without degrading ecosystems
1.3 SUSTAINABILITY
📌 Definitions Table
Term
Definition
Socioecological Systems
Integrated systems that include both human (social) and ecological components interacting to sustain environmental and societal functions.
Resilience
The ability of a system to resist or recover from disturbance while maintaining its structure and function.
Replenishment
The natural or managed process of restoring depleted resources or stocks within an environmental system.
Biodiversity
The variety and variability of life at genetic, species, and ecosystem levels within a given area.
Brundtland Report
The 1987 UN report “Our Common Future” that defined sustainable development as meeting present needs without compromising future generations.
Quantitative Measures
Numerical indicators used to assess environmental data, such as biocapacity, ecological footprint, or CO₂ emissions.
Biocapacity
The capacity of an area to generate renewable resources and absorb waste, especially carbon emissions, under current technology.
Ecological Footprint
The total area of biologically productive land and water required to support an individual or population’s resource use and waste assimilation.
Carbon Dioxide Equivalents (CO₂e)
A standard unit expressing the global warming potential of different greenhouse gases relative to CO₂.
Phenology
The study of periodic biological events (e.g., flowering, migration) and their relationship to seasonal or climatic changes.
SDGs (Sustainable Development Goals)
A set of 17 global goals adopted by the UN in 2015 to promote sustainability, equality, and environmental protection by 2030.
PCB (Polychlorinated Biphenyls)
Persistent organic pollutants once used in industrial processes, now banned due to their toxicity and bioaccumulation.
Transboundary Pollution
Pollution that originates in one country and crosses borders through air, water, or soil to affect other nations.
Carbon Sequestration
The process of capturing and storing atmospheric CO₂ in vegetation, soils, or geological formations to mitigate climate change.
Decouple
To separate economic growth from environmental degradation through sustainable production and consumption practices.
Natural Capital
The world’s natural resources—such as soil, air, water, and biodiversity—that provide ecosystem goods and services.
Natural Sustainable Yield
The rate at which natural capital can be exploited without depleting the original stock or its long-term productivity.
📌 Introduction to Sustainability
Understanding sustainability
Sustainability refers to the ability of a system to endure and remain viable (i.e. maintain its functionality and integrity) over time
In the context of socio-ecological systems, sustainability involves responsible practices that ensure resources are not depleted and conditions for future generations are not compromised
Sustainability of systems
All human activities are interconnected within systems
Enhancing the resilience of these systems increases sustainability
This can be achieved by making sure the system’s components are properly maintained
For example, a sustainable agricultural system must take into account multiple factors, such as soil health, water management and biodiversity, to ensure long-term productivity without degrading the environment
The three pillars of sustainability
Sustainability includes three pillars:
Environmental sustainability
Social sustainability
Economic sustainability
These pillars are interdependent and must be balanced for overall sustainability
For example, a business implementing green practices (environmental) might also improve employee well-being (social) and reduce unnecessary spending (economic) to improve the overall long-term sustainability of the business
Environmental sustainability
Environmental sustainability focuses on the responsible use and management of natural resources to ensure their replenishment and the preservation of these resources
It also focuses on allowing wholeecosystems to recover and regenerate
Strategies to achieve environmental sustainability include the following:
Resource management:
Practices that allow for the replacement of resources used, such as sustainable forestry practices
Example: sustainable aquaculture and fishery management, where fishing quotas and habitat restoration efforts ensure the replenishment of fish stocks and the preservation of marine ecosystems
Pollution control:
Efforts that aim to minimise pollution and its harmful effects on ecosystems and human health
Example: waste management schemes, like recycling programmes and waste-to-energy plants, reduce landfill waste and pollution, e.g. plastic pollution
Biodiversity conservation:
Preserving biodiversity ensures the resilience of ecosystems and supports their ability to adapt to changing conditions
Example: conservation projects, like the reintroduction of native species or habitat restoration initiatives, enhance biodiversity in local ecosystems
Active regeneration:
Beyond conservation efforts, active regeneration involves interventions aimed at restoring degraded ecosystems to a more natural state
Example: wetland restoration projects, such as those undertaken in the Norfolk Broads (UK), involve re-establishing native vegetation and hydrological patterns to enhance ecosystem functions like flood control and water purification
Ecosystem services:
Sustainable practices recognise the value of ecosystem services, such as clean water, air purification and carbon sequestration; they should aim to maintain or enhance these services
Example: urban green spaces, like London’s parks and gardens, provide essential ecosystem services by absorbing pollutants, mitigating urban heat island effects and supporting biodiversity
Long-term perspectives:
Environmental sustainability requires consideration of long-term impacts and planning for the continued health and resilience of ecosystems
Example: afforestation programmes, like the UK’s Northern Forest initiative, aim to plant millions of trees to enhance biodiversity, sequester carbon and mitigate climate change impacts over the coming decades
Social sustainability
Social sustainability focuses on creating inclusive structures and systems that support human well-being and the longevity of societies and cultures
Strategies to achieve social sustainability include the following:
Community development:
Sustainable communities prioritise equitable access to resources, services and opportunities for all members
Example: community gardens not only promote access to fresh produce but can also help build social connections and local resilience (e.g. by enhancing local food security)
Cultural preservation:
Sustainability includes efforts to maintain cultural traditions, languages and practices that contribute to the identity and cohesion of societies
Example: initiatives to revive Indigenous languages or protect cultural heritage sites can promote social sustainability by preserving cultural diversity
Health and education:
Access to healthcare, education and other essential services is crucial for social sustainability
Example: public health campaigns targeting issues like quitting smoking or adopting healthy eating habits can improve community well-being
Economic sustainability
Economic sustainability involves creating economic systems that meet present needs without compromising the ability of future generations to meet their own needs
Strategies to achieve economic sustainability include the following:
Example: adoption of circular economy principles in manufacturing, where products are specifically designed for reuse or recycling, promotes economic sustainability
Long-term planning:
Economic sustainability requires planning for the long term, considering factors like resource availability, technological advancements and market stability
Example: investment in renewable energy infrastructure not only reduces greenhouse gas emissions but also creates long-term economic opportunities in the clean energy sector
Equitable growth:
Sustainable economic development seeks to reduce inequalities and ensure fair distribution of resources and opportunities
Example: microfinance initiatives can help marginalised communities by providing access to financial capital for entrepreneurial activities and promoting economic sustainability at the grassroots level
🧠 Exam Tips:
1. Always link definitions to real-world examples in extended responses (e.g., transboundary pollution — Chernobyl fallout, 1986).
2. For “sustainability” terms, mention time scale and future generations to gain full marks.
3. When relevant, include keywords like capacity, productivity, equilibrium, stock, or flow to show conceptual understanding.
📌 Sustainable Development
Sustainable development
Sustainable development is a concept that aims to balance economic, social and environmental factors to meet the needs of the present generation without compromising the ability of future generations to meet their own needs
Examples of sustainable development include:
The use of renewable energy sources, such as wind, solar, or hydropower, instead of non-renewable energy sources, such as fossil fuels
Sustainable agriculture involves using techniques that minimise the negative impact of agriculture on the environment, such as crop rotation, soil conservation and reduced use of pesticides and fertilisers
Sustainable urban planning aims to create cities that are more liveable, efficient and environmentally friendly, such as through the use of public transportation, green spaces (e.g. public parks or green roofs) and energy-efficient buildings to mitigate climate change impacts
The concept of sustainable development gained wider recognition with the publication of the Brundtland Reportin 1987 by the World Commission on Environment and Development
The report introduced the idea of sustainable development by highlighting the importance of addressing social and economic issues alongside environmental concerns
Sustainable development requires a long-term perspective and a commitment to understanding the highly complex interactions between the economic, social and environmental aspects of our growing and developing societies
It is an ongoing process that requires the cooperation and involvement of individuals, organisations and governments at all levels
Environmental, Social and Economic Aspects of Sustainable Development
Environment
Renewable energyWaste managementWater treatmentReduce, reuse, and recycleNature reservesUrban wildlifeEcosystem services
Society
Cultural diversitySocial stabilityEducationHealthcareCrimePersonal freedomGender equality
Economy
Economic growthDeveloping nationsCost of urban infrastructureEnergy-efficient buildingsEconomic policiesInternational tradeLabour market
Unsustainable use of natural resources
Unsustainable exploitation of natural resources poses significant threats to ecosystems and human well-being
When natural resources are overused or mismanaged, it can lead to irreversible damage and ecosystemcollapse
A clear example of this is the Newfoundland cod fisheries
Economic indicators and sustainability
Traditional economic indicators, like gross domestic product (GDP), provide a limited view of economic progress and development
While GDP measures the value of goods and services produced within a country’s borders, it does not account for the depletion of natural resources or the costs of environmental degradation
This can lead to patterns of unsustainable development that prioritise short-term economic gains over long-term sustainability
Green GDP
Economists are increasingly using alternative measures that take environmental factors into account
Green GDP adjusts traditional GDP calculations by accounting for environmental costs and depletion of natural resources
By subtracting the environmental costs associated with economic activities, Green GDP provides a more accurate measure of economic progress that considers both long-term economic and environmental sustainability
For example, in China, policymakers have begun to incorporate environmental considerations into economic planning by developing measures such as Green GDP
This shows that they are starting to properly recognise the importance of sustainability in achieving long-term economic prosperity
📌 Environmental Justice
Environmental justice
Environmental justice refers to the right of all people to live in a pollution-free environment and to have equitable (i.e. fair and equal) access to natural resources
This is regardless of issues such as race, gender, socio-economic status or nationality
Inequalities and disparities
Inequalities in income, race, gender and cultural identity within and between different societies lead to disparities in access to water, food and energy
For example: Some communities cannot afford reliable access to clean water or electricity
Privatisation of water sources can make this issue worse, leading to higher costs and unequal access
In some regions, rural communities often struggle to afford electricity, limiting job opportunities and opportunities for development
Environmental injustice
Environmental injustice refers to the unequal distribution of environmental burdens and benefits, often due to factors such as race, class, or other social factors
It includes situations where marginalised communities experience a greater number of environmental hazards or lack access to environmental goods and services
At the local level, environmental injustice can occur in various ways, such as:
The presence of hazardous facilities such as landfills, incinerators, or industrial plants in or near to low-income or minority neighbourhoods
Pollution hotspots mainly harm poorer communities, causing health problems
Lack of access to clean water, safe housing, or green spaces in economically disadvantaged areas
Environmental injustice is not limited to local contexts but also occurs on a more global scale, such as:
Exploitation of natural resources in developing countries by multinational corporations, leading to environmental degradation and displacement of Indigenous communities
Export of general or hazardous waste from wealthier nations to poorer countries, exposing vulnerable populations to health risks
Climate change impacts disproportionately affecting low-income countries and communities with limited resources to adapt or mitigate
In general, environmental injustice increases existing social inequalities and undermines human rights, particularly for vulnerable populations
It often leads to negative health outcomes, economic disparities and challenges to the well-being and resilience of the communities affected
Application of sustainability and environmental justice
The principles of sustainability and environmental justice can be applied across various scales, from individual actions and decision-making to national policies to global policy frameworks
Operating scales
Individual scale:
Personal actions greatly affect the environment
Everyday choices and behaviours can shape environmental outcomes and contribute to broader patterns of consumption and resource depletion
Choices like reducing waste, saving energy and supporting eco-friendly products can make a difference
For example, choosing reusable products, using public transport and backing local green projects can help create a more sustainable world
Global scale:
International efforts like the United Nations Sustainable Development Goals (SDGs) tackle major environmental issues
By working together and being more accountable for their actions, countries can protect the environment and work towards removing environmental injustices
For example, SDG 13 focuses on fighting climate change and building a greener future for everyone
📌 Sustainability Indicators
Sustainability indicators
Sustainability indicators are quantitative measures used to assess various aspects of sustainability
These indicators can be specific to biodiversity, pollution, human population, climate change and many other factors
Some well-known sustainability indicators include ecological footprints, carbon footprints and water footprints
Sustainability indicators can be applied across different scales, from local to global, to evaluate the environmental, social and economic dimensions of sustainability
For example, they can help us understand if something is environmentally friendly, socially fair and economically viable
Ecological footprints
An ecological footprint (EF) is a theoretical concept that acts as a valuable tool used to assess the environmental impact of human populations
It quantifies the area of land and water required to support a specific population at a particular standard of living
An EF is measured in global hectares(gha) per capita (i.e. hectares per person) per unit time
The ecological footprint provides a comprehensive measure of the demands that human populations place on the environment
It takes into account the resources consumed by individuals, such as food, energy, water and materials, as well as the waste generated and the ecosystem services required to absorb that waste
By considering these factors, ecological footprints help to evaluate the sustainability of human activities
Lifestyle choices, including diets and consumption patterns, affect a region’s ecological footprint size—countries that have very high consumption rates of highly processed foods have large ecological footprints due to both the resources required to sustain this diet or lifestyle and the large amount of solid domestic waste this lifestyle produces
EFs can be used to compare the sustainability of different lifestyles, businesses and even whole countries
If the EF of a lifestyle, business or country exceeds the area available to the population (also known as the biocapacity—the amount of resources that the planet can provide sustainably), it means that it is not sustainable in the long-term
In the UK, for example, the ecological footprint is estimated to be about 4.2 global hectares (gha) per person per year, whilst the biocapacity is only around 1.7 gha per person per year, indicating that the UK population is living unsustainably
To reduce an EF, it is important to adopt more sustainable practices, such as reducing meat consumption, using renewable energy sources and using public transport or walking instead of driving
EFs are a usefultool for promoting sustainable development and for raising awareness about the impact of human activities on the environment
Other sustainability indicators
Carbon footprints
The carbon footprint measures the amount of greenhouse gases (GHGs) produced by a person, activity, business or country
Carbon footprints are usually measured in carbon dioxide equivalents (in tonnes) per year
Carbon footprints can help us understand how much our actions contribute to global climate change
For example, the carbon footprint of a UK citizen is approximately 5.5 tonnes of CO2 per year
Water footprints
Water footprints measure the amount of water used directly or indirectly to produce certain goods and services
For example, this could include water used for crop irrigation or water used for manufacturing processes
Understanding water footprints helps us manage water resources more sustainably
Water footprints are usually measured in cubic metres per year
📌 Citizen Science
Citizen science
Citizen science involves members of the public participating in scientific research projects, contributing data, observations, or resources
Citizen science has the potential to play a very important role in monitoring Earth systems and assessing whether resources are being used sustainably
Monitoring earth systems
Local relevance:
Citizen science projects are often used to gather data relevant to local environmental issues and conditions
For example, the UK’s Open Air Laboratories (OPAL) network engages citizens in monitoring air and water quality, biodiversity and climate change impacts in their local areas
Global impact:
Data collected through citizen science initiatives can also contribute significantly to research on more global-scale environmental issues
For example, the Global Learning and Observation to Benefit the Environment (GLOBE) Programme involves students and citizens worldwide in collecting and sharing environmental data, contributing to our understanding of global climate patterns
Integration with scientific research
Complementing professional research:
Citizen science projects can complement traditional scientific research by engaging a larger pool of participants and increasing data collection capacity
For example, the UK Ladybird Survey uses citizen scientists from across England, Scotland, Wales and Northern Ireland to monitor ladybird populations, aiding researchers in studying the impact of invasive species and climate change on native biodiversity
Diverse data collection:
Citizen scientists provide valuable insights due to their varied backgrounds, locations and perspectives, contributing to morecomprehensive datasets
For example, the UK “Bioblitz” events bring together scientists and the public to survey and record species in specific areas, enhancing our understanding of local biodiversity
📌 Sustainability Frameworks and Models
UN Sustainable Development Goals
There are a range of frameworks and models that support our understanding of sustainability
Sustainability models, like all models, are simplified versions of reality
This means they have both uses and limitations
The United Nations created one of these models, known as the Sustainable Development Goals (SDGs), in 2015
In 2015, the United Nations Member States committed to a shared plan for peace and prosperity for people and the planet, now and into the future
This plan is called the 2030 Agenda for Sustainable Development
The UN Sustainable Development Goals (SDGs) are a comprehensive set of social and environmental objectives that were established as targets for the 2030 Agenda
These goals aim to provide a universal framework for addressing urgent global challenges whilst promoting sustainable development and environmental justice
The SDG model recognises that ending poverty must go hand-in-hand with strategies that improve health and education, reduce inequality and generate economic growth—all while tackling climate change and working to preserve ecosystems such as our oceans and forests
The 17 Sustainable Development Goals
The SDG model consists of 17 goals and 169 targets covering various aspects of sustainable development
Goals range from eradicating poverty and hunger to promoting sustainable cities and combating climate change
The SDGs provide both a target for sustainable development and a metric to measure the progress made
Uses of the SDGs
Common ground for policymaking:
The SDGs provide a shared agenda for governments, organisations (NGOs and IGOs) and communities to develop policies and initiatives
Global relevance:
The SDGs are applicable to both developed and developing countries, encouraging a universal approach to sustainability
Galvanising the international community:
The SDGs encourage collaboration and collective action among nations and stakeholders to address economic and social inequalities
Limitations of the SDGs
Insufficient ambition:
Criticisms suggests that the SDGs do not go far enough in addressing the magnitude of global challenges
Top-down approach:
Some argue that the SDGs are bureaucratic and fail to adequately involve local communities in decision-making processes
Ignoring local contexts:
The SDGs may overlook the unique socio-cultural, economic and environmental contexts of different regions
Data deficiency:
The lack of comprehensive and accurate data hinders monitoring and evaluation of progress towards achieving the SDGs
Planetary boundaries model
The planetary boundaries model outlines nine critical processes and systems that have regulated the stability and resilience of the Earth system during the Holocene epoch
Scientists created the model to specify the ecological systems on Earth within which humanity could operate safely.
It identifies limits to human disturbance on these processes and systems to prevent abrupt and irreversible changes
Explanation of the Nine Planetary Boundaries
Planetary boundary
Explanation
Example
Climate change
The human-induced alteration of Earth’s climate systemEvidenced by rising global temperatures, sea level rise and extreme weather events
Increasing frequency and intensity of hurricanes
Erosion of biosphere integrity (biodiversity loss)
The reduction in Earth’s variety of life due to human activityDue to habitat destruction, species extinction and ecosystem degradation
Deforestation of the Amazon rainforest leading to loss of species diversity
Biogeochemical flows (nitrogen and phosphorus cycles)
The disruption of natural nutrient cycles due to agricultural and industrial activitiesExcessive use of fertilisers leads to water pollution, algal blooms and dead zones
“Dead Zone” in the Gulf of Mexico brought on by Mississippi River nutrient runoff
Stratospheric ozone depletion
The thinning of Earth’s ozone layer due to human-made chemicals like chlorofluorocarbons (CFCs)Ozone depletion increases exposure to UV radiation, harming ecosystems and human health
Antarctic ozone hole formed by CFC emissions
Ocean acidification
The lowering of pH levels due to increased carbon dioxide absorption by oceansAcidification damages marine life, especially organisms with calcium carbonate shells
Coral bleaching in the Great Barrier Reef due to ocean acidification
Freshwater use
The unsustainable extraction and use of freshwater resourcesOveruse leads to the depletion of aquifers, reduced river flows and ecosystem degradation
Aral Sea shrinking due to excessive irrigation withdrawals
Land system change
The conversion of natural ecosystems into urban, agricultural and industrial areasLeads to loss of biodiversity, soil erosion and disruption of carbon and water cycles
Deforestation of the Amazon for cattle ranching and soy production
Chemical pollution (introduction of novel entities in the environment)
The release of synthetic chemicals into the environmentPollutants harm human health, ecosystems and wildlife
PCB contamination in rivers affecting fish populations
Atmospheric aerosol loading
The emission of particulate matter and aerosols into the atmosphereAerosols impact climate, air quality and human health
Smog formation in cities is due to industrial emissions
Uses of the planetary boundary model
Identifies science-based limits:
Provides clear boundaries based on scientific understanding of Earth systems
Highlights of the need for comprehensive action:
Shifts focus beyond climate change (which dominates current discussion) to address other critical environmental issues
Raises awareness:
Alerts the public and policymakers about the urgency of protecting Earth’s systems
Limitations of the planetary boundary model
Ignores societal factors:
It focuses only on ecological systems and does not consider the human dimension necessary to take action for environmental justice
Work in progress:
Assessments of boundaries are constantly changing as new data becomes available
Global focus may not suit local action:
Boundaries may not align with local or national priorities, making necessary actions challenging to implement at these smaller scales
📌 Alternative Economic Models
Doughnut economics model
The doughnut economics model provides a framework for building an economy that meets the needs of all people while staying within the ecological limits of the planet
It emphasises the importance of creating a regenerative and distributive economy
Regenerative economy
A regenerative economy is one that works within the natural cycles and limits of the planet
It aims to restore and renew (i.e. regenerate) resources rather than deplete them
For example, transitioning from fossil fuels to renewable energy sources like solar and wind power
Distributive economy
A distributive economy is one that shares value and opportunities more equitably among all stakeholders
It aims to reduce inequality and ensure a fair distribution of resources.
For example, implementing policies such as universal basic income to provide economic security for all citizens
Social foundation
The inner ring or inner boundary of the doughnut model is known as the “social foundation”
It is based on the social Sustainable Development Goals (SDGs)
This boundary represents the minimum standards for human well-being, including access to education, healthcare and social protection
For example, ensuring everyone has access to clean water and sanitation
Ecological ceiling
The outer ring or outer boundary of the doughnut model is known as the “ecological ceiling”
It is based on planetary boundaries science (i.e. the theory behind the planetary boundaries model)
This boundary represents the limits of the Earth’s ecosystems and resources
For example, adopting water conservation measures to sustainably manage freshwater resources and prevent depletion
Together, the social foundation and the ecological ceiling represent the minimum conditions for an economy that is ecologically safe and socially just
This is why the middle of the doughnut is referred to as the “safe and just space for humanity”
Image source: savemyexams.com
Moving into the doughnut
Today, billions of people still fall short of the social foundation, while humanity has collectively overshot most of the planetary boundaries (we have “broken through” the ecological ceiling)
Therefore, as this model illustrates, humanity’s objective is to “move into the doughnut” and establish an economy that enables all societies to prosper in harmony with the rest of the living world
Making economies that are regenerative and distributive by design is the only way to achieve it
This requires drastic changes but needs to start with the implementation of policies and practices that promote sustainability and equity
Uses of the doughnut economics model
Supports environmental justice:
The model includes both ecological and social elements, so it supports the concept of environmental justice
Raises awareness:
The model has reached popular awareness and highlights the interconnectedness of social and environmental issues, raising public understanding and engagement in sustainable development efforts
Applied at various scales:
From countries to cities to individual businesses, the model helps sustainable development efforts by providing a flexible framework adaptable to different contexts and scales
Promotes interdisciplinary collaboration:
Encourages collaboration between economists, environmentalists, policymakers and communities to address complex sustainability challenges
Limitations of the doughnut economic model
Lacks specificity:
The model is a work-in-progress that offers broad principles but lacks detailed guidance on specific policies and actions needed for implementation. Some critics argue that the model is too theoretical and lacks practical solutions for complex economic issues
Challenges in application:
Different contexts may require specific approaches and translating the model into realistic and effective strategies at local or national levels can be complex
Changing nature:
As our understanding of sustainability evolves and new data emerges, the boundaries of the model may need adjusting
Circular economy model
The circular economy model is a sustainable economic system designed to minimise waste and maximise resource efficiency
It aims to decouple economic growth from the consumption of finite resources, promoting long-term environmental sustainability
Principles of the circular economy
The circular economy model has three main principles:
Eliminating waste and pollution:
Focuses on reducing waste generation and minimising environmental pollution
Encourages the redesign of products and processes to eliminate waste at the source
For example, designing products that use biodegradable materials, in order to reduce landfill waste
Circulating products and materials:
It involves maintaining products, components and materials at their highest utility and value, for as long as possible
Promotes reuse, repair, remanufacturing and recycling to extend product lifecycles
For example, furniture companies offer repair services to extend the lifespan of their products
Regenerating nature:
Aims to restore and enhance natural capital while promoting economic growth
Includes practices such as reforestation, sustainable agriculture and ecosystem restoration
For example, using regenerative agriculture techniques to improve soil health and biodiversity
Butterfly diagram
The Ellen MacArthur Foundation introduced the butterfly diagram to represent the circular economy idea visually.
It contrasts with the linear economic model (take–make–waste) by illustrating the continuous flow of resources in a circular manner
Within the circular economy, there are two cycles:
The biological cycle is where the biodegradable products are returned to the natural environment
The technical cycle where products are recycled, reused, repaired or remanufactured
Image source: savemyexams.com
Uses of the circular economy model
Regeneration of natural systems:
Supports ecosystem restoration and biodiversity conservation
Reduction of greenhouse gas emissions:
Promotes energy efficiency and the use of renewable resources
Improvement of local food networks and support of local communities:
Encourages sustainable agricultural practices and local food production
Reduction of waste by extending the product life cycle:
Emphasises product durability, repairability and recyclability
Changed consumer habits:
Encourages mindful consumption and responsible product choices
Limitations of the circular economy model
Lack of environmental awareness by consumers and companies:
Challenges in educating consumers and businesses about the importance of circular practices
Lack of regulations enforcing the recycling of products:
Inadequate policies and regulations to incentivise and enforce recycling
Some waste is not recyclable (technical limitations):
Certain materials pose challenges for recycling due to technical constraints
For example, mixed-material packaging that is difficult to separate and recycle effectively
Lack of finance:
Financial barriers to implementing circular economy initiatives, especially for small businesses
For example, there can be high upfront costs for transitioning to circular production methods
1.2 SYSTEMS
📌 Definitions Table
Term
Definition
System
A set of interrelated parts that work together to form a functioning whole, with inputs, outputs, storages, and flows of energy or matter.
Transfers
Movements of energy or matter through a system without changing its form or state (e.g., water flow, animal migration).
Transformations
Processes that change energy or matter from one form or state to another (e.g., photosynthesis, respiration).
Emergent Properties
Characteristics that arise from the interactions of system components, not present in the individual parts alone.
Trophic Cascades
Indirect effects in an ecosystem triggered when changes in predator populations alter the abundance or behavior of prey and lower trophic levels.
Predator–Prey Cascades
A type of trophic cascade where predators regulate prey populations, maintaining ecosystem balance and biodiversity.
Global Geochemical Cycles
Large-scale natural processes that circulate elements such as carbon, nitrogen, and phosphorus through the Earth’s spheres.
Dynamic Equilibrium
A state of balance within a system where inputs and outputs fluctuate around a stable average over time.
Terrariums
Closed, self-sustaining micro-ecosystems used to model energy and matter flow in a controlled environment.
Microcosm
A small-scale, simplified model of an ecosystem used to study ecological processes under controlled conditions.
Homeostasis
The tendency of a system to maintain internal stability despite external changes through feedback mechanisms.
Anthropomorphism
The attribution of human traits or emotions to non-human entities, often leading to biased interpretations in ecology.
Albedo
The fraction of solar radiation reflected by a surface; high albedo surfaces (like ice) reflect more sunlight, affecting climate regulation.
Reproductive Potential
The maximum possible rate of reproduction of a species under ideal environmental conditions.
Tipping Points
Critical thresholds where small changes lead to drastic, often irreversible, shifts in system state or stability.
Resilience
The capacity of a system to resist or recover from disturbance while maintaining its structure and function.
Model
A simplified representation of a system used to describe, explain, or predict environmental phenomena.
🧠 Exam Tip: It is important to keep definitions concise but include keywords like system, equilibrium, feedback, transformation, energy flow to show conceptual understanding.
📌 The Systems Approach
A systems approach is a way of visualizing a complex set of interactions which may be ecological or societal.
🔍 TOK Tip: To what extent can ecological models predict real-world outcomes?
A systems approach is the term used to describe a method of simplifying and understanding a complicated set of interactions
Systems, and the interactions they contain, may be environmental or ecological (e.g. the water cycle or predator-prey relationships), social (e.g. how we live and work) or economic (e.g. financial transactions or business deals)
The interactions within a system, when looked at as a whole, produce the emergent properties of the system
For example, in an ecosystem, all the different ecological interactions occurring within it shape how that ecosystem looks and behaves – if the interactions change for some reason (e.g. a new predator is introduced), then the emergent properties of the ecosystem will change too
There are two main ways of studying systems:
A reductionist approach involves dividing a system into its constituent parts and studying each of these separately – this can be used to study specific interactions in great detail but doesn’t give the overall picture of what is occurring within the system as a whole
A holistic approach involves looking at all processes and interactions occurring within the system together, in order to study the system as a whole
For example, sustainability or sustainable development depends on a highly complex set of interactions between many different factors
These include environmental, social and economic factors (sometimes referred to as the three pillars of sustainability
A systems approach is required in order to understand how these different factors combine and interact with one another, as well as how they all work together as a whole (the holistic approach)
These interactions produce the emergent properties of the system.
The concept of a system can be applied to a range of scales.
A system consists of storages and flows.
The flows provide inputs and outputs of energy
The flows are processes and may be either transfers (a change in location) or transformations (a change in the chemical nature, a change in state or a change in energy).
The flows are processes that may be either:
Transfers (a change in location)
Transformations (a change in the chemical nature, a change in state or a change in energy)
Transfers and Transformations
These are two fundamental concepts in systems (and systems diagrams) that help to understand how matter and energy move through a system
Transfers are the movement of matter or energy from one component of the system to another, without any change in form or quality
For example, water flowing from a river to a lake is a transfer
Transformations, on the other hand, involve a change in the form or quality of matter or energy as it moves through the system
For example, when sunlight is absorbed by plants, it is transformed into chemical energy through the process of photosynthesis
Transfers and transformations are often represented in systems diagrams by arrows that connect the different components of the system
Arrows that represent transfers are usually labeled with the quantity of matter or energy being transferred (e.g., kg of carbon, kJ of energy), while arrows that represent transformations may include additional information about the process involved (e.g., photosynthesis, respiration)
Systems diagrams can help to identify the key transfers and transformations that occur within a system and how they are interconnected
By understanding these processes, it is possible to identify opportunities to improve the efficiency or sustainability of the system
Transfers and transformations can occur at different scales within a system, from the molecular level to the global level
For example, at the molecular level, nutrients are transferred between individual organisms, while at the global level, energy is transferred between different biomes
Image source: savemyexams.com
🌐 EE Tip: Choose a local issue (e.g. landfill management or wetland conversion) and apply systems diagrams to analyze inputs, outputs, and feedback loops.
📌 Types of Systems
There are three main types of systems. These are:
Open systems
Closed systems
Isolated systems
The category that a system falls into depends on how energy and matter flow between the system and the surrounding environment
Open Systems
Both energy and matter are exchanged between the system and its surroundings
Open systems are usually organic (living) systems that interact with their surroundings (the environment) by taking in energy and new matter (often in the form of biomass), and by also expelling energy and matter (e.g. through waste products or by organisms leaving a system)
An example of an open system would be a particular ecosystem or habitat
Your body is also an example of an open system – energy and matter are exchanged between you and your environment in the form of food, water, movement and waste
Closed Systems
Energy, but not matter, is exchanged between the system and its surroundings
Closed systems are usually inorganic (non-living), although this is not always the case
The International Space Station (ISS) could perhaps be seen as a closed system
It is a self-contained environment that must maintain a balance of resources, including air, water, and food, as well as waste management, energy production, and temperature control
The ISS cannot exchange matter with its surroundings
The Earth (and the atmosphere surrounding it) could be viewed as a closed system
The main input of energy occurs via solar radiation
The main output of energy occurs via heat (re-radiation of infrared waves from the Earth’s surface)
Matter is recycled completely within the system
Although, technically, very small amounts of matter enter and leave the system (in the form of meteorites or spaceships and satellites), these are considered negligible
Artificial and experimental ecological closed systems can also exist – for example, sealed terrariums, containing just the right balance of water and living organisms (such as mosses, ferns, bacteria, fungi or invertebrates) can sometime survive for many years as totally closed systems, if light and heat energy is allowed to be exchanged across the glass boundary
Isolated Systems
Neither energy nor matter is exchanged between the system and its surroundings
Isolated systems do not exist naturally – they are more of a theoretical concept (although the entire Universe could be considered to be an isolated system)
Ecosystems are open systems. Closed systems only exist experimentally although the global geochemical cycles approximate to closed systems.
Systems at different scales
Systems are structures made up of interconnected parts that work together towards a common goal or function
In a similar way, environmental systems are interconnected networks of components and processes within the environment, found at various scales from single organisms to huge ecosystems
These environmental systems include interactions between living organisms, their habitats and physical elements like water, air and soil, shaping Earth’s environment and influencing its dynamics and functions
Environmental systems can be observed and analysed at a range of different scales
For example, a bromeliad (a type of plant commonly found in tropical rainforests) could represent a small-scale local ecological system
Within the leaves of the bromeliad, various organisms interact, forming a microcosm of life
The entire rainforest itself represents a large-scale ecosystem, where countless species interact within a complex web of relationships
Within the rainforest, there are predator-prey relationships, symbiotic relationships, species competing for resources and nutrient cycles all occurring within the system
It could also be argued that the entire planet can be considered to be one giant, self-contained system
The Earth’s atmosphere, oceans and land are highly interconnected and regulate environmental conditions to maintain conditions suitable for life
Earth as a single integrated system
Instead of just a collection of independent parts, Earth can be seen as a complex, integrated system comprised of many interconnected components, including:
Biosphere: includes all living organisms on Earth and their interactions with the environment
Hydrosphere: includes all water bodies on Earth, including oceans, rivers, lakes and groundwater
Cryosphere: includes all forms of frozen water on Earth’s surface, such as glaciers, ice caps and permafrost
Geosphere: refers to the solid Earth, including rocks, minerals and landforms such as mountains and valleys
Atmosphere: includes the layer of gases surrounding the Earth, including the troposphere, stratosphere, mesosphere, thermosphere and exosphere
Anthroposphere: represents the sphere of human influence on the environment, including human activities, infrastructure and urbanisation
Gaia hypothesis
The Gaia hypothesis (also known as the Gaia theory), initially proposed by James Lovelock in the 1970s, presents a holistic view of the Earth as a single, self-regulating system
Lovelock proposed that Earth’s biota (living organisms) and their environment are closely linked and act together as an integrated system
His theory suggests that feedback mechanisms within Earth’s systems help maintain stability and balance on a global scale, a bit like homeostasis in living organisms
Variations and developments:
Initially, the Gaia hypothesis was introduced to explain how the composition of the Earth’s atmosphere affects global temperatures and how these two factors are connected or “controlled” via complex feedback methods
For example, the presence of greenhouse gases, such as carbon dioxide and methane, in the Earth’s atmosphere can increase global temperatures
In response to these rising temperatures, feedback mechanisms, such as increased evaporation leading to more cloud cover or enhanced plant growth absorbing more carbon dioxide, may act to mitigate temperature increases
Over time, the Gaia hypothesis has undergone various interpretations and refinements, with contributions from scientists such as Lynn Margulis
Some scientists have criticised the Gaia hypothesis for its anthropomorphism, comparing the Earth to a living organism, and lack of testability, while others consider it a useful theory for understanding Earth’s interconnected systems
📌 Stable Equilibrium and Feedback Mechanisms
Equilibria
An equilibrium refers to a state of balance occurring between the separate components of a system
Open systems (such as ecosystems) usually exist in a stable equilibrium
This means they generally stay in the same state over time
They can be said to be in a state of balance
A stable equilibrium allows a system to return to its original state following a disturbance
Stable Equilibria
The main type of stable equilibrium is known as steady-state equilibrium
A steady-state equilibrium occurs when the system shows no major changes over a longer time period, even though there are often small, oscillating changes occurring within the system over shorter time periods
These slight fluctuations usually occur within closely defined limits and the system always return back towards its average state
Most open systems in nature are in steady-state equilibrium
For example, a forest has constant inputs and outputs of energy and matter, which change over time
As a result, there are short-term changes in the population dynamics of communities of organisms living within the forest, with different species increasing and decreasing in abundance
Overall however, the forest remains stable in the long-term
Another type of stable equilibrium would be static equilibrium
There are no inputs or outputs (of energy or matter) to the system and therefore the system shows no change over time
No natural systems are in static equilibrium – all natural systems (e.g. ecosystems) have inputs and outputs of energy and matter
Inanimate objects such as a chair or desk could be said to be in static equilibrium
Static and steady-state equilibria are both types of stable equilibria
Stable vs Unstable Equilibria
A system can also be in an unstable equilibrium
Even a small disturbance to a system in unstable equilibrium can cause the system to suddenly shift to a new system state or average state (i.e. a new equilibrium is reached)
Image source: savemyexams.com
A system can be in a stable equilibrium or an unstable equilibrium
Positive & Negative Feedback
Most systems involve feedback loops
These feedback mechanisms are what cause systems to react in response to disturbances
Feedback loops allow systems to self-regulate
Image source: savemyexams.com
Changes to the processes in a system (disturbances) lead to changes in the system’s outputs, which in turn affect the inputs
There are two types of feedback loop:
Negative feedback
Positive feedback
Negative Feedback
Negative feedback is any mechanism in a system that counteracts a change away from the equilibrium
Negative feedback loops occur when the output of a process within a system inhibits or reverses that same process, in a way that brings the system back towards the average state
In this way, negative feedback is stabilizing – it counteracts deviation from the equilibrium
Negative feedback loops stabilize systems
Image source: savemyexams.com
Examples of negative feedback include predator-prey relationships and parts of the hydrological cycle
Positive Feedback
Positive feedback is any mechanism in a system that leads to additional and increased change away from the equilibrium
Positive feedback loops occur when the output of a process within a system feeds back into the system, in a way that moves the system increasingly away from the average state
In this way, positive feedback is destabilizing – it amplifies deviation from the equilibrium and drives systems towards a tipping point where the state of the system suddenly shifts to a new equilibrium
Positive feedback loops destabilize systems
Image source: savemyexams.com
Other examples of positive feedback:
Positive feedback loops amplify changes within a system
They can lead to either an increase or a decrease in a system component.
Example: population decline
Population decline reduces reproductive potential
Reduced reproductive potential further decreases the population
This amplifying loop accelerates the decline
Example: population growth
Population growth increases reproductive potential
Increased reproductive potential triggers further population growth
This positive feedback loop accelerates population expansion
📌 Tipping points and Resilience
Tipping Points
A tipping point is a critical threshold within a system
If a tipping point is reached, any further small change in the system will have significant knock-on effects and cause the system to move away from its average state (away from the equilibrium)
In ecosystems and other ecological systems, tipping points are very important as they represent the point beyond which serious, irreversible damage and change to the system can occur
Positive feedback loops can push an ecological system towards and past its tipping point, at which point a new equilibrium is likely to be reached
Eutrophication is a classic example of an ecological reaching a tipping point and accelerating towards a new state
Tipping points can be difficult to predict for the following reasons:
There are often delays of varying lengths involved in feedback loops, which add to the complexity of modeling systems
Not all components or processes within a system will change abruptly at the same time
It may be impossible to identify a tipping point until after it has been passed
Activities in one part of the globe may lead to a system reaching a tipping point elsewhere on the planet (e.g. the burning of fossil fuels by industrialized countries is leading to global warming, which is pushing the Amazon basin towards a tipping point of desertification) – continued monitoring, research and scientific communication is required to identity these links
Image source: savemyexams.com
(A) The system is subject to a pressure that pushes it towards a tipping point. (B) The system’s tipping point (critical threshold) is reached. Like a ball balancing on a hill, at this stage even a minor push is enough to cross the tipping point, upon which positive feedback loops accelerate the shift (D) into a new state (E). The change to the new state is often irreversible or a high cost is required to return the system back to its previous state, which is illustrated in the figure as a ball being in a deep valley (E) with a long uphill climb back to the previous state (F)
Resilience
Any system, ecological, social or economic, has a certain amount of resilience
This resilience refers to the system’s ability to maintain stability and avoid tipping points
Diversity and the size of storages within systems can contribute to their resilience and affect their speed of response to change
Systems with higher diversity and larger storages are less likely to reach tipping points
For example, highly complex ecosystems like rainforests have high diversity in terms of the complexity of their food webs
If a disturbance occurs within one of these food webs, the animals and plants have many different ways to respond to the change, maintaining the stability of the ecosystem
Rainforests also contain large storages in the form of long-lived tree species and high numbers of dormant seeds
These factors promote a steady-state equilibrium in ecosystems like rainforests
In contrast, agricultural crop systems are artificial monocultures meaning they only contain a single species. This low diversity means they have low resilience – if there is a disturbance to the system (e.g. a new crop disease or pest species), the system will not be able to counteract this
Image source: savemyexams.com
A system with high resilience (such as a tropical rainforest) has a greater ability to avoid tipping points than a system with low resilience (such as an agricultural monoculture)
Humans can affect the resilience of natural systems by reducing the diversity contained within them and the size of their storages
Rainforest ecosystems naturally have very high biodiversity
When this biodiversity is reduced, through the hunting of species to extinction or the destruction of habitat through deforestation, the resilience of the rainforest ecosystem in reduced – it becomes increasingly vulnerable to further disturbances
Natural grasslands have high resilience, due to large storages of seeds, nutrients and root systems underground, allowing them to recover quickly after a disturbance such as a fire (especially if they contain a diversity of grassland species, including some which are adapted to regenerate quickly after fires)
However, when humans convert natural grasslands to agricultural crops, the lack of diversity and storages (e.g. no underground seed reserves) results in a system that has low resilience to disturbances such as fires.
📌 Models
A model is a simplified version of reality and can be used to understand how a system works and predict how it will respond to change.
A model inevitably involves some approximation and loss of accuracy.
Strengths and Limitations of Models
Strengths
Limitations
Models simplify complex systems
Models can be oversimplified and inaccurate
Models allow predictions to be made about how systems will react in response to change
Results from models depend on the quality of the data inputs going into them
System inputs can be changed to observe effects and outputs, without the need to wait for real-life events to occur
Results from models become more uncertain the further they predict into the future
Models are easier to understand than the real system
Different models can show vastly different outputs even if they are given the same data inputs
Results from models can be shared between scientists, engineers, companies and communicated to the public
Results from models can be interpreted by different people in different ways
Results from models can warn us about future environmental issues and how to avoid them or minimize their impact
Environmental systems are often incredibly complex, with many interacting factors – it is impossible to take all possible variables into account
Viewpoints shaped by environmental value systems (EVSs), influenced by culture, education, and experience, determining how environmental issues are interpreted.
Assumptions
Unverified ideas or beliefs underpinning interpretations, decisions, or models in environmental management.
Sociocultural norms
Shared cultural beliefs and practices influencing individual and societal interactions with the environment.
Sustainability
The use of resources at a rate that allows natural regeneration and ensures ecosystem integrity for future generations.
Patagonia
A region known for ecological significance and conservation efforts; also a company promoting corporate environmental responsibility.
Likert
A scale-based tool used in surveys to quantify subjective data, typically used in social research within IAs.
Moral Compass
An individual’s internalized ethical framework guiding value judgments about environmental issues.
EVS
Environmental Value System – A worldview influencing environmental perceptions, decisions, and evaluations of environmental threats.
Ecocentrism
An EVS prioritizing ecological integrity and the intrinsic value of all living organisms and ecosystems.
Technocentrism
An EVS that promotes technological and scientific solutions to manage and solve environmental problems.
Anthropocentrism
An EVS viewing humans as central, where nature is valued primarily for its usefulness to human societies.
Inherent Worth
The intrinsic value of species or ecosystems, independent of their utility to humans.
Sustainable Development
Development that balances environmental, social, and economic needs without compromising future generations’ ability to meet theirs.
Primatology
The scientific study of primates, often contributing to biodiversity conservation and ethical debates in environmental science.
DDT
A persistent organic pollutant and insecticide that bioaccumulates and causes ecological harm, especially to avian species.
Bioaccumulation
The build-up of non-biodegradable pollutants in an organism’s tissues over time, often leading to biomagnification.
📌 Factors Influencing Perspectives
What is a perspective?
A perspective is how an individual sees and understands a particular situation
Perspectives are formed based on individual assumptions, values and beliefs
They are shaped by a combination of personal experiences, cultural background and societal influences
For example, perspectives are often informed and justified by various factors including:
Sociocultural norms
Scientific understandings
Laws
Religion
Economic conditions
Local and global events
Lived experience (i.e. events someone has personally experienced during their lives)
Perspectives are not fixed and can evolve over time as individuals gain new experiences and insights
Environmental perspectives
Different perspectives on environmental issues can lead to contrasting approaches to conservation and resource management
For example, those with a more human-based perspective may prioritise human interestsand well-being in environmental decision-making
This perspective might support conservation measures that benefit humans directly, such as clean water initiatives
In contrast, those with an environmentalist perspective may place great value on the intrinsic worth of nature and ecosystems
Supporters of this perspective may prioritise biodiversity conservation and ecosystem health, even if it does not directly benefit humans
Social perspectives
Social perspectives shape attitudes and responses to social issues such as poverty, inequality and justice
For example, a collectivist perspective may prioritise the well-being of the community over individual rights
Policies based on this perspective might focus on social welfare programs and taxes
In contrast, an individualistic perspective emphasises personal responsibility and freedom of choice
Policies based on this perspective might involve promoting entrepreneurship and reducing government intervention
Distinction between perspectives and arguments
On the other hand, someone opposing these regulations might present counterarguments based on economic concerns or individual freedoms
🧠 Examiner Tip: It is important to note that a perspective is not the same as an argument. Arguments are constructs used to support or challenge a particular perspective
They are logical or reasoned explanations presented to persuade other people of the validity of a perspective (i.e. that a particular viewpoint is credible and true)
Arguments can be constructed to defend a personally held perspective or to criticise and counter an opposing viewpoint
For example, someone who is advocating for stricter environmental regulations might present arguments based on scientific evidence to support their perspective
📌 Values and Environmental Perspectives
What are values?
Values are qualities or principles that people believe have worth and importance in life
They guide our behaviours, attitudes and decisions
Examples include honesty, integrity, fairness and compassion
Influence of values
Values affect people’s priorities, judgements, perspectives and choices
They are deeply personal, but a variety of cultural and social factors also play a role.
For example, in some cultures, respect for elders is highly valued, shaping how individuals interact within society
In line with the principles of sustainability and conservation, movements like Greta Thunberg’s Fridays for the Future call for immediate action on climate change
Values in community
Within our communities, we share and shape our values
They are reflected in how we communicate and interact with others, both within our own community and with external communities
For example, a community that values environmental sustainability may organise clean-up events or support green policies
Values in organisations
Organisations also have values, which can be seen in their communication and actions
These values are often expressed through advertisements, social media, policies and organisational decisions
For example, a company that values diversity and inclusion may have policies supporting equal opportunities and representation in their workforce
Companies like Patagonia demonstrate values of environmental stewardship through initiatives like donating a portion of profits to environmental causes
Tensions from different values
Different values often lead to tensions between individuals or between organisations
Conflicts can happen when important values clash, like when some people want to freely express themselves but others want to be respectful of different cultures
In multicultural societies, navigating these tensions requires understanding and respecting diverse values
Value Surveys
Understanding perspectives on environmental issues
Values surveys investigate the perspectives of social groups towards various environmental issues
They help us understand how environmental concerns are viewed and prioritised by individuals or communities
For example, a survey could explore attitudes towards renewable energy adoption, waste reduction, or conservation efforts
Another survey could ask about attitudes towards using public transportation to reduce carbon emissions
Effective design of value surveys
A well-designed environmental value survey is able to:
Take different viewpoints into account
Look at the whole range of opinions within a group about environmental matters
The results of an effective survey should be able to:
Give insights into attitudes, beliefs and values that influence how people view and respond to local and global environmental challenges
Implementation of surveys
Surveys, questionnaires, or interviews can be used to gather data on environmental attitudes
Using online survey tools can be very useful for:
Collecting data from a wider audience
Collecting a greater volume of data
Collecting data in a shorter amount of time
Efficient analysis of data
Closed-ended questions are good for quantitative analysis (i.e. they provide structured data that can be easily quantified and analysed statistically)
Closed-ended questions are those that provide respondents with a fixed set of options to choose from
Examples include multiple-choice questions, rating scales and Likert scale items
For example, in a survey about environmental attitudes, closed-ended questions could include:
Which of the following renewable energy sources do you believe is most effective in reducing carbon emissions? (a) Solar (b) Wind (c) Hydroelectric (d) Geothermal
Indicate the extent to which you agree or disagree with the statement: “Using public transportation is an effective way to reduce air pollution”. Strongly agree, Agree, Neutral, Disagree, Strongly disagree
On a scale of 1 to 5, with 5 being very likely, how likely are you to recycle paper products?
🧠 Examiner Tip: Responses to these questions can be easily quantified (given a value or score)
This allows statistical analysis to be used on the data
This helps identify trends, correlations and patterns in attitudes towards specific environmental issues
For example, there is an environmental education campaign designed to increase recycling rates
It is important to measure the effectiveness of this campaign
A survey can be used to collect quantitative data on attitudes towards recycling
This can then be correlated with data on actual actual recycling rates
Surveys or interviews can also include open-ended questions to help capture more detailed responses
These types of response are more difficult to analyse
However, they can still be valuable for gaining deeper insights into individual viewpoints
Behaviour-time graphs
If value surveys are repeated over time, the results can be used to produce behaviour-time graphs
Behaviour-time graphs show changes in behaviours or lifestyles over time
They help to visualise trends, patterns and shifts in behaviour related to environmental actions
Behaviour-time graphs can track changes in daily habits over a set period of time, such as:
Energy consumption
Waste generation
Transportation choices
For example, a graph could illustrate a decrease in household electricity usage over several months
This could be due to energy-saving measures like installing LED lights or adjusting thermostat settings
These graphs can also illustrate changes in environmental behaviours, such as:
Recycling rates
Composting practices
Water conservation efforts
Behaviour-time graphs can be valuable tools for:
Monitoring progress towards sustainability goals
Evaluating the effectiveness of environmental initiatives
They can help to:
Visualise the impact of interventions
Identify areas for further improvement
📌 Worldviews and Environmental Perspectives
What are worldviews?
Worldviews can be described as the lenses through which groups of people to see and understand the world around them (it is just their “view of the world”)
They are made up of cultural beliefs, philosophical ideas, political opinions, religious teachings and many other factors
For example, in some cultures, the idea of family and community is highly valued, while in others, individual achievement and success are prioritised
Worldviews shape how people think, what they believe and how they behave
They influence our moral compass, our judgments and our decisions
For example, a person who grew up in a religious household may have different views on topics like abortion or marriage compared to someone who didn’t
🔍 TOK Tip: How do values and cultural worldviews influence how people interpret environmental data?
How do worldviews differ from perspectives?
Worldviews generally encompass a broader and deeper set of beliefs, values and ideologies that shape how individuals or groups perceive and interpret the world around them, whereas perspectives are usually more specific and immediate viewpoints or attitudes individuals hold on particular issues or topics
Perspectives are often more situational and may be more likely to change based on circumstances or new information
Impact of technology and media
With the rise of the internet and social media, people are exposed to a wide range of worldviews beyond their local community
For example, a teenager from one part of the globe can quickly learn about different world cultures, religions, and political ideologies just by scrolling through their social media feed
Attempts to categorise different perspectives into groups can be challenging because individuals often have a complex mix of beliefs and opinions
For example, a person might identify as liberal on social issues but be more conservative on economic policies
An EVS might be considered as a ‘system’ in the sense that it may be influenced by education, experience, culture and media (inputs) and involves a set of interrelated premises, values and arguments that can generate consistent decisions and evaluations (outputs).
EVS Inputs and Outputs
There is a spectrum of EVSs from ecocentric through anthropocentric to technocentric value systems.
Ecocentrism
Ecocentrism is a philosophical and ethical approach that prioritises the intrinsic value of nature and the environment over human needs and interests
This approach emphasises that all living organisms and ecosystems have inherent worth and should be protected for their own sake
Ecocentrism advocates for sustainable practices that maintain the balance and integrity of ecosystems and the natural world, rather than exploiting them for human benefit
This approach is often associated with environmental movements and conservation efforts that aim to protect biodiversity, ecosystems and natural resources
Anthropocentrism
Anthropocentrism is a worldview that places human beings at the centre of the universe, prioritising human needs and interests over those of other living beings and the environment
This approach emphasises that humans have the right to use natural resources and ecosystems for their own benefit
Although an anthropocentric viewpoint would ideally involve sustainable managing global systems, in reality anthropocentrism often results in unsustainable practices such as overexploitation of natural resources, habitat destruction, and pollution
This approach only values preserving biodiversity when it can provide economic and ecological advantages to humans
This approach is often criticised by environmentalists and conservationists for ignoring the intrinsic value of nature and its ecosystems
❤️ CAS Tip: Organize a sustainability audit at school (waste, water, energy) and propose improvements.
Technocentrism
This approach is often criticised by environmentalists for being short-sighted and ignoring the complex and interconnected nature of environmental issues
Technocentrism is a worldview that places technology and human ingenuity at the centre of all problem-solving and decision-making processes, often overlooking the impact on the environment and other living beings
This approach emphasises the use of technology to overcome environmental problems and maintain human well-being
Technocentrism often assumes that all environmental problems can be solved through technological innovation and economic growth, which may lead to neglect of the need for conservation and sustainability
Strengths and Limitations of Contrasting EVSs
EVS
Advantages
Disadvantages
Ecocentrism (Deep ecologists)
Reuses materials so more sustainable Minimises environmental impact by encouraging restraint Better for long-term human wellbeing No need to wait for technology to develop
Conservation can be expensive with no obvious or quick economic return Many countries are still developing economically and argue they should be allowed to continue Difficult to change individual attitudes
Technocentrism (Cornucopians)
Substitutes materials so avoids costly industrial change Provides solutions so people are not inconvenienced Allows social and economic progress
Allows even greater rates of resource consumption May give rise to further environmental problems High cost Humans increasingly disconnected from nature
📌 The Environmental Movement
The environmental movementis the term used to describe humanity’s increasing awareness of the damage we are causing to the environment and the importance of conserving the environmental health of our planet
The movement includes a diverse range of individuals, organisations and initiatives united by a common goal: to address urgent environmental challenges such as climate change, pollution, habitat destruction and species extinction
The movement promotes sustainable development, responsible resource management, conservation of biodiversity and the transition to cleaner, renewable energy sources
This can be achieved by implementing changes in public policy and encouraging changes in our individual behaviours
Through education, advocacy, activism and policy-making, the environmental movement aims to create a more sustainable and resilient future for both humanity and the natural world
Various different factors, including people, books, films and historical events, have been key in the development of the environmental movement
These events and influences have come from many different areas, including:
1. Environmental Activists
2. Literature
3. Media
4. Major environmental disasters
5. International conferences and agreements
6. New technologies
7. Scientific discoveries
Individuals and Environmental Activists
Individual
Field
Description
Effect on Environmental Movement
Wangarĩ Maathai
Conservation
Founded the Green Belt Movement, advocating for tree planting, conservation, and women’s rights
Mobilised grassroots activism and promoted environmental conservation on a local and globalscale
Greta Thunberg
Climate action
Led global youth strikes for climateaction, raising awareness and challenging political leaders
Inspired millions worldwide to join climate activism, urging policymakers to take urgent climate action
Vandana Shiva
Environmentalism
Advocated for sustainable agriculture and biodiversity conservation, questioning corporate dominance
Raised awareness of the impacts of industrial agriculture and promoted sustainable, community-based alternatives
David Attenborough
Conservation
Renowned naturalist and broadcaster, raising awareness of environmental issues through documentaries
Educated and inspired audiences worldwide, fostering greater appreciation and concern for the natural world
Jane Goodall
Primatology
Pioneering primatologist, advocating for wildlife conservation and ethical treatment of animals
Advancing our understanding of animal behaviour and conservation, empowering individuals to protect biodiversity and habitats
Literature
Author
Year
Work
Description
Effect on Environmental Movement
Aldo Leopold
1949
A Sand County Almanac
Advocated for a land ethic, promoting conservation and stewardship of the natural world
Influential in shaping modern conservation ethics and inspiring environmental activism
Rachel Carson
1962
Silent Spring
Outlined the harmful effects of the pesticide DDT passing along food chains to top predators
Led to widespread concern about the dangers of pesticide use and increased awareness of environmental pollution
Donella Meadows, Dennis Meadows, Jørgen Randers, William W. Behrens III
1972
The Limits to Growth (LTG)
A report, commissioned by the Club of Rome (a global think tank), outlining the effects of a rapidly increasing global population on Earth’s finite natural resources
Increased awareness of the dangers of unsustainable natural resource use (best-selling environmental publication in history)
James Lovelock
1979
Gaia
The first book to suggest that Earth is like a ‘living organism’ (a self-regulatory system that maintains its climate and biology)
Showed how humanity has the power to upset the delicate balance of the Earth’s self-regulating processes, with potentially deadly consequences
Edward Abbey
1975
The Monkey Wrench Gang
Novel about eco-sabotage and resistance against environmental destruction, inspiring direct action
Influenced environmental activism by promoting radical tactics and raising awareness of conservation issues
Donella Meadows
1992
Beyond the Limits
Follow-up to “The Limits to Growth”, exploring strategies for achieving sustainable development
Contributed to discussions on sustainability and influenced policy-making towards more eco-friendly practices
Media
Media
Year
Description
Effect on Environmental Movement
An Inconvenient Truth
2006
A documentary film of former US Vice President Al Gore giving a lecture on climate change and its consequences
The film got extensive publicity, reaching a huge worldwide audience and triggering a major shift in public opinion in the USA
No Impact Man
2009
Documentary film following a family’s attempt to live a zero-waste lifestyle in New York City
Raised awareness about individualcarbon footprintsand the potential for sustainable living in urban environments
Before the Flood
2016
Documentary featuring Leonardo DiCaprio exploring climate change impacts and solutions
Raised awareness of climate change issues and advocated for renewable energy and conservation efforts
Our Planet
2019
Netflix documentary series showcasing Earth’s natural beauty and the impact of human activity
Raised awareness of environmental conservation and the need to protectecosystems and biodiversity
Breaking Boundaries
2021
Netflix documentary on how humans are pushing Earth beyond the boundaries that have kept the planet stable for the last 10 000 years, narrated by David Attenborough
Highlighted pressing environmental issues and the importance of global cooperation for sustainable solutions
Major Environmental Disasters
Event
Year
Description
Effect on Environmental Movement
Minamata disease in Minamata, Japan
1956
Chemical factories released toxic methyl mercury into waste water— mercury accumulation in fish and shellfish caused mercury poisoning in local people, with severe symptoms (neurological disorders, paralysis, death, or birth defects in newborns)
Raised awareness of the risks of industrialisation and the need for environmental regulations and checks to be imposed on industries
Industrial accident in Bhopal, India
1984
Explosion at a pesticide plant—released 42 tonnes of toxic methyl isocyanate gas, killing 10 000 people in the first 72 hours and 25 000 in total
Highlighted industrial risks and lack of safety measures, driving demands for stricter regulations and corporate accountability
Chernobyl nuclear meltdown, Soviet Ukraine
1986
Nuclear reactor exploded—radioactive fallout covered large areas of Ukraine, Belarus and Russia—336 000 people had to be evacuated and cancer incidence increased in surrounding area
Reinforced society’s fear and negative perceptions surrounding nuclear power, strengthening calls for safer energy alternatives and stricter regulations on nuclear facilities
Fukushima nuclear meltdown, Japan
2011
Earthquake-generated tsunami hit nuclear power station and caused a meltdown in three of the six reactors—110 000 people evacuated
Intensified global concerns about nuclear safety and encouraged shifts towards renewable energy sources—however, Japan temporarily halted all nuclear power to carry out new safety checks, leading to increased dependence on fossil fuels
International Conferences and Agreements
Event
Year
Description
Effect on Environmental Movement
Stockholm Declaration
1972
The first major United Nations (UN) conference on international environmental issues, held in Stockholm, led to this Declaration
Influential in setting environmental targets and shaping action at the localand international level
Rio Earth Summit
1992
UN Conference on Environment and Development, attended by 172 nations—outlined that radical changes in attitudes towards the environment needed to limit the damage to the planet
Had a global impact—led to the adoption of ‘Agenda 21’ (a comprehensive action plan to ensure sustainable development) by over 178 parties
Kyoto Protocol
1997
An international treaty building on the UN Framework Convention on Climate Change (UNFCCC) that committed state parties to reduce greenhouse gas emissions
192 parties committed to reducing their emissions of greenhouse gases such as carbon dioxide and methane
Rio+20
2012
UN Conference on Sustainable Development, marking the 20th anniversary of the Rio Earth Summit – aimed to secure further political commitment from nations to sustainable development
Helped to assess progress on various internationally agreed targets (e.g. reduction of greenhouse gas emissions) and identify emerging environmental challenges
Paris Agreement
2015
An international treaty agreed by 195 parties at COP21 – aimed to hold the increase in global average temperature to below 2 °C above pre-industrial levels
50% cut in greenhouse gas emissions needed by 2030—every country (including developing countries) agreed to set targets and regularlyreport on their progress
Glasgow Climate Pact
2021
At COP26, an international agreement between 197 countries was reached, which reaffirmed the Paris Agreement’s global temperature goal
First climate deal to explicitly commit to reducing coal use—a late intervention from China and India weakened the pact’s wording to “phasing down” coal (rather than phasing it out)
COP27
2022
The 27th United Nations Climate Change conference, held in Sharm El Sheikh, Egypt
Led to the creation of the first loss-and-damage fund and addressed measures to limit global temperature rise
COP28
2023
The 28th United Nations Climate Change conference, held in Expo City, Dubai, UAE
The final agreement made at this conference commits signatory countries to move away from carbon energy sources to mitigate climate change effects
New Technologies
Development
Description
Effect on Environmental Movement
Green Revolution
Agricultural advancements increasing crop yields in the mid-20th century, addressing food scarcity
Improved food securityand reduced pressure on natural habitats, but also raised concerns about the environmental impacts of intensive farming practices
Enteric fermentation control
Methods to decrease methane emissions from livestock, reducing agriculture’s environmental footprint—strategies may include dietary adjustments, such as altering feed composition to improve digestion efficiency and reduce methane production, or supplementing diets with compounds that inhibit methane-producing microorganisms
Reduces greenhouse gas (methane) emissions from agriculture, mitigating the environmental impact of livestock and lowering climate change impacts
Plant-based meats
Innovations creating meat substitutes from plant sources, offering environmentally-friendly alternatives
Reduces demand for animal agriculture, mitigating deforestation, habitat loss and greenhouse gas emissions
Electric cars
Vehicles powered by electric motors instead of internal combustion engines, reducing reliance on fossil fuels and emissions of greenhouse gases
Lowers carbon emissions and air pollution, driving the transition to sustainable transportation and energy systems
Scientific Discoveries
Discovery
Description
Effect on Environmental Movement
Pesticide and biocide toxicity
Studies revealing the harmful effects of pesticides and biocides on ecosystems and human health
Increased awareness of environmental risks, leading to regulatory measures, pesticide bans, and adoption of alternative pest control methods
Species loss
Research documenting the rapid decline of species diversity globally due to human activities
Raised alarm about biodiversity loss and the extinction crisis, driving conservation efforts and policy actions to protect ecosystems and species
Habitat degradation
Investigations highlighting the destruction and fragmentation of natural habitats worldwide
Highlighted the urgent need for habitat conservation and restoration, leading to the establishment of protected areas and restoration initiatives
Ocean acidification
Phenomenon of decreasing pHlevels in the Earth’s oceans, mainly due to increased carbon dioxide emissions
Raised concerns about marine ecosystem health and biodiversity, driving research and policy actions to address ocean acidification impacts
Climate change impacts
Research documenting the diverse effects of climate change on ecosystems, economies and human societies
Increased understanding of climate change risks and vulnerabilities, motivating adaptation and mitigation efforts to address its impacts