A systematic error in thinking that affects judgments and decisions due to heuristics or emotional influences.
Heuristic
A mental shortcut or rule of thumb that simplifies decision-making but can lead to bias.
Confirmation bias
The tendency to search for, interpret, and remember information that confirms one’s pre-existing beliefs.
Anchoring bias
The tendency to rely too heavily on an initial piece of information (the “anchor”) when making judgments.
Framing effect
Decisions are influenced by the way choices are presented (positive or negative framing).
Availability heuristic
Judging the likelihood of events based on how easily examples come to mind.
Representative heuristic
Judging probability based on similarity to a prototype rather than actual statistics.
📌Core Concepts
Human decision-making is often irrational and influenced by cognitive biases.Rather than using logic or probability, individuals use heuristics — mental shortcuts — to make quick judgments.While useful in daily life, heuristics can lead to systematic errors, affecting reliability in cognitive processing.
📌Key Studies
📄 Tversky & Kahneman (1974) – Anchoring Bias
Aim: To investigate how an initial anchor influences numerical estimates.
Procedure:
Participants spun a wheel rigged to land on 10 or 65.
Then asked whether the percentage of African nations in the UN was higher or lower than the number on the wheel, and to estimate the true value.
Findings:
Group 10 → median estimate 25%.
Group 65 → median estimate 45%. Conclusion:
Anchors bias judgments even when clearly irrelevant.
How rational are humans in making decisions? Do cognitive biases reveal the limits of reason as a way of knowing? TOK connections to emotion, reason, and intuition highlight how biases emerge from emotional or cultural framing rather than objective logic.
🌐 Real-World Connection
Economics: Anchoring and framing influence consumer pricing and financial behavior.
Law: Judges and juries are affected by anchoring during sentencing.
Healthcare: Framing can affect patient risk perception and treatment choices.
Media: Confirmation bias shapes political polarization and misinformation.
❤️ CAS Link
Create an awareness campaign about bias in decision-making in schools or communities.
Reflect on personal biases in leadership roles or volunteering decisions.
Conduct a simulation project showing how framing alters group decisions.
🧠 IA Guidance
Great topic for a simple experiment:
IV: Anchoring condition (high vs. low number).
DV: Numerical estimate (e.g., price, population).
Reproduce a simplified Tversky & Kahneman (1974) design using online surveys.
Ensure full debriefing and avoid deception about purpose.
🧠 Examiner Tips
Always name Tversky & Kahneman (1974) for anchoring.
Use Englich & Mussweiler (2001) for applied bias research.
For SAQs, define the bias before describing the study.
ERQs: Integrate multiple biases for high-level synthesis.
Connect biases to reliability of cognition — biases lower reliability.
nth root of x, written √[n]{x}. Example: 91⁄2 = √9 = 3.
xm⁄n
First take the nth root, then raise to the power m: xm⁄n = (√[n]{x})m.
Example: 82⁄3 = (³√8)2 = 22 = 4.
x−m⁄n
Take the reciprocal and then the fractional power: x−m⁄n = 1 ÷ xm⁄n.
Example: 16−1⁄2 = 1 ÷ 161⁄2 = 1 ÷ 4.
🌍 Real-World Connection:
Rational exponents appear whenever a law looks like y = kxm⁄n, for example in physics (square-root dependence of period on length in pendulums) and biology (body-mass scaling of metabolic rate).
📌 Why Write Roots as Powers?
Using rational exponents lets us apply the usual index laws (product, quotient, power of a power)
to expressions involving roots. This makes algebraic manipulation easier and more systematic.
🧠 Examiner Tip:
In AHL questions you are expected to:
Rewrite surds like √x and ³√x as x1⁄2 and x1⁄3.
Use index laws to simplify, then convert back to root form only if the question asks.
📌 Interpreting a Rational Exponent
1. Denominator → root
x1⁄2 means “square root of x”.
x1⁄3 means “cube root of x”.
In general, x1⁄n = √[n]{x}.
2. Numerator → power
x3⁄2 = (√x)3.
x5⁄3 = (³√x)5.
3. Negative sign → reciprocal
x−1⁄2 = 1 ÷ x1⁄2 = 1 ÷ √x.
x−3⁄4 = 1 ÷ x3⁄4 = 1 ÷ (⁴√x)3.
🔍 TOK Perspective:
Writing roots as powers is a choice of representation.
Does changing from √x to x1⁄2 change our understanding of the quantity,
or only our language for manipulating it?
📌 Using Index Laws with Rational Exponents
The usual index laws still hold for rational exponents (for x > 0):
Product law: xa × xb = xa + b.
Quotient law: xa ÷ xb = xa − b.
Power of a power: (xa)b = xab.
Example 1 – Multiplying fractional powers
Simplify 51⁄2 × 51⁄3.
Same base 5, so use the product law: add exponents.
1⁄2 + 1⁄3 = 3⁄6 + 2⁄6 = 5⁄6.
Result: 51⁄2 × 51⁄3 = 55⁄6.
📐 IA Spotlight:
In an IA involving power-law data, you can write models as y = kxm⁄n.
Simplifying rational exponents makes it easier to compare different models and interpret
the meaning of the exponent m⁄n in your context.
Example 2 – Power of a power (from the guide)
Simplify 323⁄5.
Write 32 as a power of 2: 32 = 25.
Now 323⁄5 = (25)3⁄5.
Use the power-of-a-power rule: multiply exponents → 25 × 3⁄5 = 23.
Final answer: 23 = 8.
Example 3 – Negative rational exponent
Show that x−1⁄2 = 1 ÷ √x.
By definition of a negative exponent, x−1⁄2 = 1 ÷ x1⁄2.
x1⁄2 is the square root of x, so x1⁄2 = √x.
Therefore x−1⁄2 = 1 ÷ √x.
📱 GDC Tip:
When unsure, type both the original expression and your simplified answer into your GDC.
If the decimal values match, your simplification is very likely correct.
📝 Paper 1 Strategy:
First rewrite all roots as fractional powers (no radicals).
Apply index laws carefully to combine or simplify.
Only convert back to radical form if the question specifically wants a root.
❤️ CAS Idea:
Design a short workshop for younger students where you explain why 323⁄5 is exactly 8,
using both radical notation and rational exponents, and let them explore similar examples on a GDC.
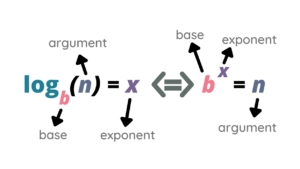
The power to which the base a must be raised to obtain x.
If ak = x, then logax = k.
Base
The fixed number a in logax. In this topic, a = 10 or a = e only.
Domain
We must have a > 0, a ≠ 1, and x > 0. Logarithms of 0 or negatives are not real.
🌍 Real-World Connection: Logarithms appear in pH (chemistry), Richter scale (earthquakes), decibels (sound), and in analysing exponential growth and decay in biology and economics.
📌 Understanding Logarithms
Logarithms are the inverse of exponentials.
If 103 = 1000, then log10(1000) = 3.
If e2 ≈ 7.389, then ln(7.389) = 2.
They answer the question: “What exponent produced this number?”
Using laws of logarithms lets us simplify expressions, solve equations, and transform data.
In AHL 1.9, we assume the base is 10 (log) or e (ln).
🧠 Examiner Tip: Always check that the argument of a log is positive.
If you get log(−2) or log(0), something has gone wrong in your working.
📌 Law 1 – Product Law
Statement (for a > 0, a ≠ 1, x > 0, y > 0):
loga(x·y) = logax + logay
Intuition:
Multiplying inside the log becomes adding exponents.
If ap = x and aq = y, then xy = ap·aq = ap+q.
Therefore loga(xy) is the single exponent p+q, i.e. logax + logay.
Worked Example 1: Simplify log10(2000).
Write 2000 as 2 × 1000 = 2 × 10³.
log(2000) = log(2 × 10³) = log(2) + log(103).
log(103) = 3, so log(2000) = log(2) + 3.
Worked Example 2: Expand ln(5e).
ln(5e) = ln(5 × e) = ln(5) + ln(e).
ln(e) = 1, so ln(5e) = ln(5) + 1.
📌 Law 2 – Quotient Law
Statement (for a > 0, a ≠ 1, x > 0, y > 0):
loga(x ÷ y) = logax − logay
Intuition:
Division inside the log becomes subtracting exponents.
If ap = x and aq = y, then x ÷ y = ap−q.
So loga(x ÷ y) = p − q = logax − logay.
Worked Example: Simplify log(50) − log(2).
Combine using the quotient law in reverse: log(50) − log(2) = log(50 ÷ 2).
📱 GDC Tip: Use your calculator to check simplified expressions numerically.
For example, confirm that log(24) and log(3) + log(8) give the same decimal value.
📐 IA Spotlight:
You can model exponential growth/decay data (e.g. cooling, bacteria growth, finance)
and then use logarithms to linearise the relationship, allowing you to fit a straight line and estimate parameters.🌐
📝 Paper 1 Strategy:
When simplifying an expression with logs:
First, rewrite products, quotients and powers using the three laws.
Then combine like terms (for example 2logx − logx = logx).
Keep the base consistent: do not mix log base 10 and ln unless the question explicitly changes base.
8.3 URBAN AIR POLLUTION
📌 Definitions Table
Term
Definition (Exam-Ready, 2 Marks)
Urban Smog
Air pollution in cities caused by the accumulation of industrial and vehicular emissions, often worsened by temperature inversions.
Pedestrianising
The process of converting streets or areas for pedestrian-only use to reduce traffic, pollution, and improve urban livability.
Green Walls
Vertical structures covered with vegetation that reduce heat, filter air pollutants, and enhance urban biodiversity.
Scrubbers
Pollution control devices used in industrial settings to remove harmful gases and particulates from exhaust emissions.
🧠 Exam Tips:
For urban air pollution terms, always mention sources and impacts on health or climate when elaborating.
Connect green walls and pedestrianising to urban sustainability or heat island mitigation in evaluation questions.
📌 Causes of Urban Air Pollution
Human activities that release harmful substances into the atmosphere cause urban air pollution
Pollutants in the air can come from many sources and impact both human health and the environment
Common pollutants include:
Nitrogen oxides (NOx)
Sulphur dioxide (SO2)
Carbon monoxide (CO)
Particulate matter (PM)
Particulate matter refers to tiny solid particles or liquid droplets in the air
These particles can come from dust, soot, smoke, and vehicle emissions
Particulate matter can be classified by size:
PM2.5: fine particles with a diameter of 2.5 micrometres or smaller
PM10: larger particles with a diameter of 10 micrometres or smaller
🌐 EE Tip: Study air pollution or heat island effects in different parts of your city, linking to socio-economic variables.
Primary pollutants
Primary pollutants are harmful substances that are:
Directly emitted from a source
Immediately active in the atmosphere
They enter the air through various activities like burning fossil fuels, industrial processes, or natural events such as volcanic eruptions
Sources of primary pollutants
Natural sources:
Some air pollutants come from natural events that occur without human involvement
Forest fires: release smoke, ash, and particulate matter into the air
Dust storms: strong winds lift dust from dry areas, which spreads to cities
Volcanic eruptions: these produce large amounts of SO2 and ash
Anthropogenic (human-made) sources:
Many pollutants in urban areas come from human activities, especially those involving the burning of fuels
Burning fossil fuels: emissions from vehicles, power plants, and factories produce NOx, SO2, CO, and PM
Agricultural burning and deforestation: these release large quantities of smoke, dust, and other pollutants into the atmosphere
Construction sites and roads: create dust and PM from the movement of machinery and vehicles
Industrial processes: factories release pollutants like NOx and PM from smokestacks and chemical processing
Common pollutants from urban activities
The most common pollutants in urban areas are usually linked to the combustion of fossil fuels
Particulate matter (PM2.5 and PM10): tiny particles from exhaust fumes, industrial activities, and construction dust
CO: released by cars and industrial processes that burn fuels
NOx: produced by vehicle emissions and power plants
SO2: released mainly by burning coal and oil
Secondary pollutants
Secondary pollutants are not emitted directly but form in the atmosphere when primary pollutants react with other chemicals
Tropospheric ozone (O3): forms when nitrogen oxides (NOx) react with sunlight
It is a major component of urban smog
Examples of urban air pollution
Beijing, China: often experiences high levels of PM2.5, mainly due to coal burning for energy and industrial activity
Los Angeles, USA: struggles with ozone pollution due to a high number of vehicles and sunny weather, which speeds up the reaction that forms ozone
The burning of crops, industrial activity, and vehicle emissions frequently cause severe airpollution inNew Delhi, India
📌 Air Pollution Management Strategies
Air pollution management strategies are designed to reduce harmful emissions and improve air quality in urban areas
These strategies focus on:
Reducing the sources of pollution
Promoting cleaner technologies
Encouraging sustainable urban living
Reducing the use of fossil fuels
One of the most effective ways to manage urban air pollution is to reduce the reliance on fossil fuels
This includes:
Promoting the use of renewable energy sources like wind, solar, and hydro to power cities
Improving public transport systems in cities to reduce car usage, e.g.
Electric buses
Efficient metro systems
Creating infrastructure for cycling, e.g.
More cycle lanes
Cycle-hire schemes
Pedestrianising city centres
Emission zones and car restrictions
Emission zones are areas where only vehicles meeting certain environmental standards are allowed to enter
Low Emission Zones (LEZs) restrict high-polluting vehicles, reducing air pollution in the city centre
For example, London has an Ultra Low Emission Zone (ULEZ) where only vehicles meeting strict emission standards can drive
Some cities also restrict car use on certain days or at peak times to decrease congestion and emissions
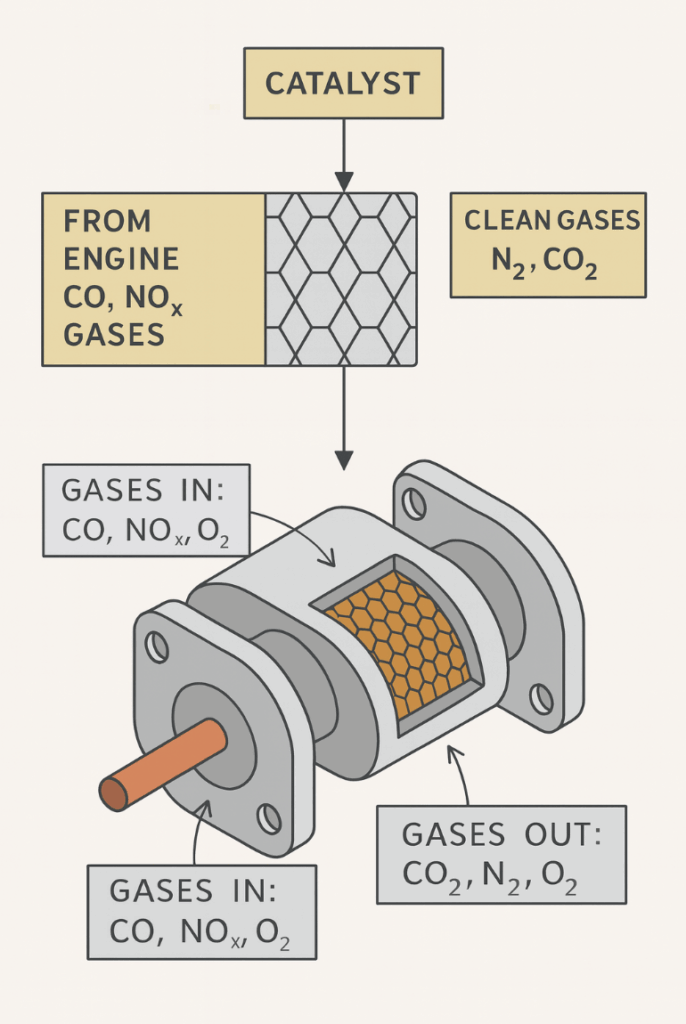
Catalytic converters
Catalytic converters are devices fitted to car exhaust systems that reduce harmful emissions
They contain catalysts that speed up chemical reactions to convert pollutants like nitrogen oxides and carbon monoxide into less harmful gases such as nitrogen and carbon dioxide
In many countries, it is compulsory for vehicles to have catalytic converters
Growing trees and natural screens
Trees and green spaces play an important role in filtering pollutants from the air
Trees can reduce air pollution and improve air quality by:
Absorbing carbon dioxide
Trapping particulate matter
Natural screens such as hedges, tree lines and green walls can also help reduce pollutants near roads and buildings
Green walls and green roofs
Green walls and green roofs are covered with vegetation and can improve air quality by filtering pollutants
They also help regulate temperature, reducing the urban heat island effect
📌 Acid Rain
Acid rain formation
Acid rain refers rainfall that has a pH lower than normal rainwater
Regular rain has a pH between 5 and 5.5, meaning it is naturally slightly acidic
Acid rain is more acidic, has a pH lower than 5, and is frequently the result of human activity
Chemical reactions leading to acid rain
Nitrogen oxides (NOx) and sulphur dioxide (SO2) are the main gases responsible for acid rain
These gases react with water and oxygen in the atmosphere to form nitric acid and sulfuric acid
Formation of nitric acid
Nitrogen oxides are mainly produced from vehicle exhausts
The reactions are as follows:
Nitrogen monoxide (NO) reacts with oxygen (O2) to form nitrogen dioxide (NO2)
2NO + O2 → 2NO2
The nitrogen dioxide then reacts with water (H2O) and oxygen in the air to produce nitric acid (HNO3)
4NO2 + O2 + 2H2O → 4HNO3
Formation of sulphuric acid
Sulphur dioxide is produced by burning fossil fuels and reacts with water in the atmosphere
The reactions are as follows:
Sulphur dioxide (SO2) dissolves in rainwater, producing sulphurous acid (H2SO3)
SO2 + H2O → H2SO3
The sulphurous acid is then oxidised by oxygen in the air to produce sulfuric acid (H2SO4)
2H2SO3 + O2 → 2H2SO4
Types of deposition
Wet deposition refers to acidic precipitation falling to Earth in the form of rain, snow, or fog
Sulphuric acid and nitric acid can also combine with ash and other particles present in the air, forming dry particles (i.e. acidic dust and gases)
Dry deposition occurs when these particles settle on surfaces, including vegetation, buildings, cars and soil
Acid rain impacts
Impacts on terrestrial habitats
Acidic deposition from acid rain accelerates the leaching of essential nutrients from soil, such as calcium, magnesium and potassium
Leaching of these nutrients reduces their availability for plants
This leads to nutrientdeficiencies
This reduces plant growth and overall ecosystem productivity
Acidic rain can increase soil toxicity
This can occur by mobilising harmful metals like aluminium
This damages plant roots and affects their ability to absorb water and nutrients
Acid rain causes direct damage to foliage
This weakens trees, making them more vulnerable to disease and harsh weather
Coniferous forests, e.g. forests of pine or spruce trees, are sensitive to acid rain
This is due to their shallow root systems and thin bark
Acid rain also damages their foliage and inhibits nutrient absorption
Impacts on freshwater habitats
Acid rain can make water bodies more acidic
This is due to a process referred to as solubilisation of aluminium
Acid rain causes aluminium, which is normally bound in the soil, to dissolve
This allows the aluminium to enter nearby water bodies
This aluminium is toxic to aquatic life, such as fish and freshwater invertebrates
Fish gills can become coated with aluminium
This makes it harder for them to breathe
Some invertebrates with exoskeletons may have difficulty maintaining their protective shells
They rely on calcium to build and maintain their hard outer shells
When acid rain increases the acidity of water, it reduces the availability of calcium and other minerals that these organisms need
This makes it harder for them to properly develop or maintain their exoskeletons
Impacts on buildings and infrastructure
Corrosion of construction materials
Acid rain erodes materials like marble, limestone, steel, and paint used in buildings and monuments
Marble and limestone both contain calcium carbonate (CaCO3)
The calcium carbonate reacts with sulphuric acid or nitric acid, causing stonework to corrode and weaken
For example, the Taj Mahal in India, made of marble, has shown signs of erosion and discolouration due to acid rain
Acid rain has also had an impact on historical statues and structures, such as those in Rome and Greece
Impacts on human health
Respiratory issues
Acid rain does not directly harm humans
However, nitrate and sulphate particles from acid rain can cause respiratory problems
PM2.5 particles (tiny air pollutants) from acid rain can enter the lungs
This leads to:
Tissue damage
Lung inflammation
An increased risk of conditions such as asthma and bronchitis
As a result, areas with heavy industrial activity, such as parts of China and Eastern Europe, experience greater respiratory health risks
Acid rain management strategies
There arethree main levels of pollution management strategies:
Changing human activity
Regulating and reducing quantities of pollutants released at the point of emission
Cleaning up the pollutants and restoring the ecosystem after pollution has occurred
These levels can also be applied to acid rain management strategies
Acid rain requires effective pollution management strategies to mitigate its harmful effects on the environment and human health
1. Altering human activity
Reducing the consumption of fossil fuels is a key strategy to minimise acid rain
Encourage the use of alternative energy sources, such as renewable energy, can significantly reduce emissions of sulphur dioxide and nitrogen oxides
International agreements and national governments play a vital role in:
Promoting sustainable practices
Supporting the development of clean technologies
Lobbying for emissions reductions
2. Regulating and monitoring pollutant release
Government regulations and monitoring systems are essential to control and reduce the release of pollutants that contribute to acid rain
Coal-burning power plants and vehicles are major sources of sulphur dioxide and nitrogen oxide emissions
Installing pollution control devices such as scrubbers and catalytic converters can effectively remove these pollutants from emissions
3. Clean-up and restoration measures
In areas heavily affected by acid rain, certain strategies may be used to mitigate the damage caused
For example, spreading ground limestone or lime in acidified lakes and rivers can neutralise acidity and restore the water’s pH balance
Restoring damaged ecosystems can also be achieved through re-colonisation efforts, such as planting acid-tolerant vegetation
This can help restore ecological balance to these damaged ecosystems
8.2 URBAN SYSTEMS & URBAN PLANNING
📌 Definitions Table
Term
Definition (Exam-Ready, 2 Marks)
Urban Heat Islands
Urban areas that experience higher temperatures than surrounding rural areas due to human activity and heat-absorbing surfaces.
Horticulture
The cultivation of fruits, vegetables, and ornamental plants, often on a smaller scale and with intensive techniques.
City Farms
Community-managed urban spaces where crops and animals are raised to promote local food production and environmental education.
🧠 Exam Tips:
Link urban heat islands to albedo, impervious surfaces, and climate adaptation in extended responses.
Use examples (e.g., rooftop gardens or urban farms) when asked for application or solutions.
📌 Urban Areas
an urban area is a built-up environment with:
A high population density
A large concentration of buildings and man-made infrastructure
Urban areas serve as centres for residential, cultural, economic, trade and social activities
Cities, towns and suburbs are examples of urban areas
Urban areas contrast with rural areas
Rural areas have:
Lower population densities
More dispersed settlements, often focused on agriculture and natural landscapes
For example, London, UK, is a large urban area with dense population, infrastructure and cultural hubs whereas the Lake District in the UK is a rural area with scattered villages and a focus on agriculture and tourism
Urban ecosystems
Urban ecosystems are unique environments found within cities and towns
They occur where human activities interact with natural elements like plants, animals and climate
These ecosystems have both biotic components (living organisms like plants, animals and humans) and abiotic components (non-living parts like soil, water, air and urban infrastructure).
Types of urban ecosystems
Residential gardens:
Gardens found in residential areas are important urban ecosystems, providing habitats for plants, birds, insects and small mammals
These areas also help to improve air quality and reduce the effects of urban heat islands
Industrial sites:
Industrial areas include factories, warehouses and other business operations
These areas may cause pollution, but some are now being redeveloped with green spaces to improve the environment
Inner-city derelict land:
Abandoned or derelict land in cities can become important for wildlife and urban regeneration projects
These areas often develop biodiversity as nature reclaims the land
Green areas and open spaces:
Urban parks and green spaces are essential ecosystems, offering habitats for animals, improving air quality and providing recreational space for people
Traffic corridors:
Areas alongside roads and railways form their own ecosystems, with hardy plants and animals that can survive in polluted or disturbed environments
Urban planners can design green corridors along these routes to help connect different wildlife habitats within cities
Cemeteries:
Cemeteries are often quiet, green spaces within urban areas that support a wide range of plant and animal life
They can act as biodiversity hotspots, with trees, grass and other vegetation supporting birds, insects and small mammals
Waste disposal areas:
Landfills and waste treatment plants are part of urban ecosystems
Although they can cause pollution, they are also home to certain species of birds, insects and bacteria that thrive in waste environments
Forests, fields and water bodies:
Some urban areas contain patches of forests, fields, lakes or rivers, which provide crucial habitats for wildlife and help with urban temperature regulation
Components of urban ecosystems
Urban infrastructure: buildings, roads, bridges and other structures are integral to urban ecosystems, affecting how people and nature interact
Biotic components:
Plants (trees, shrubs, grass) found in parks, gardens and along streets
Animals such as birds, insects and mammals
Humans, whose activities like construction, gardening and commuting shape the ecosystem
Microorganisms, including bacteria and fungi that break down waste and enrich soil
Abiotic components:
Soil: essential for plant growth in urban parks and gardens
Water: found in rivers, lakes and urban infrastructure like water supply systems
Air: clean air is important for health but urban areas often face challenges with air pollution
Climate: urban areas often create a microclimate, with higher temperatures due to buildings and infrastructure
Urban systems
An urban system is a network of interconnected elements that work together to support life in a city or town
Urban systems involve:
Buildings
Transport
Power and energy supply
Water supply
Sewage systems
Plants and animals
Humans
Components of urban systems
Buildings and infrastructure
Buildings form the core of an urban system, providing residential, commercial and industrial spaces
Infrastructure such as roads, bridges and utilities (electricity, water and waste) connects and supports the functioning of the urban area
Transport
Urban areas rely on transport systems like roads, railways and buses to move people and goods
Efficient transport systems are essential to reduce traffic congestion and air pollution
For example, London’s Underground is a major part of the city’s urban transport system, helping to reduce road traffic
Power and energy
Urban systems require energy to power homes, businesses and industries
This energy can come from fossil fuels, nuclear power or renewable sources
Ensuring a reliable and sustainable energy supply is vital for cities to function properly
Water and sewage
Water supply systems provide clean water for drinking, washing and other daily needs
Sewage systems remove and treat wastewater to prevent pollution and maintain hygiene
Microclimate
Cities create their own microclimates
They often become warmer than surrounding rural areas (urban heat island effect)
This is due to the high concentration of human activities and infrastructure
Urban planners consider green spaces and certain building designs and materials to manage urban microclimates
Humans, plants and animals
Urban systems support human populations, as well as urban wildlife and plants in parks, gardens and green areas
These living (biotic) components of urban ecosystems provide recreational spaces and contribute to air quality and biodiversity
Other factors in urban systems
Urban waste and pollution
Cities generate large amounts of waste and pollution, including solid waste, air pollution and water contamination
Managing waste and reducing pollution is critical to maintaining urban efficiency and public health
Urban efficiency
Urban efficiency refers to how well a city uses its resources, including energy, water and transport systems
More efficient urban systems can reduce waste, cut down pollution and improve quality of life for residents
Urban sustainability
Sustainability is about ensuring that urban systems can meet the needs of the present without harming future generations
Sustainable cities focus on reducing their environmental impact by using renewable energy, reducing waste andpromoting green spaces
Urban systems can operate with different types of resource management
They might follow either a linear or circular metabolism approach, which affects sustainability and waste management in cities
Linear metabolism cities:
These are cities that follow a ‘take, use, dispose’ approach
Resources (like energy and water) are used once and then discarded as waste
This leads to high levels of consumption and pollution
Circular metabolism cities:
These are cities that focus on recycling, reusing, and reducing waste
This approach aims to minimise resource use by creating a closed-loop system where outputs (like waste) are reused as inputs (e.g. recycling materials or generating energy from waste)
❤️ CAS Tip: Participate in an urban greening or pollution-reduction project (e.g., rooftop gardening, street cleanups).
Urban resilience
Resilience refers to a city’s ability to recover from challenges like natural disasters, climate change oreconomic crises
Resilient urban systems have strong infrastructure, emergency services and disaster preparedness plans
For example, after Hurricane Katrina (2005), the city of New Orleans, USA, improved its flood defences and urban infrastructure to increase resilience against future disasters
Urban system flow diagram
An urban system can be represented using a systems flow diagram by showing how resources (inputs) move through the city, are used, and generate outputs like waste and pollution
Inputs: the resources a city needs to function
Examples: energy (electricity, fuel), water, food, goods (materials for buildings and infrastructure), and labour (human workforce)
Processes: how the city uses these inputs in its daily operations
Examples: buildings, transport systems, services (healthcare, education), and infrastructure(roads, power plants, water supply)
Outputs: the results of urban processes, often in the form of waste
Examples: solid domestic waste (rubbish, recycling), pollution (air and water), and sewage
Feedback: information or actions that help the system improve in efficiency, sustainability, and resilience
Examples: urban planning decisions (like building more green spaces), implementing renewable energy, and waste management initiatives
📌 Urbanisation
Urbanisation is the process where a growing proportion of a country’s population moves from rural areas (countryside) to urban areas (cities and towns)
This shift results in land becoming more built-up, with infrastructure, housing, and industrialisation dominating the urban landscape
As urbanisation occurs, cities:
Expand
Develop more dense populations
Experience more continuous human activity
According to the World Bank, 56% (4.4 billion) of the world’s population now live in towns and cities
Rural–urban migration
Rural-urban migration is a major factor driving urbanisation
It is the movement of people from the countryside to cities in search of:
Better living conditions
Job opportunities
Safety
This migration causes the urban population to grow, often at the expense of the rural population
For example, in China, rural-urban migration has led to massive city growth, with people moving from farming regions to cities like Shenzhen and Beijing in search of jobs in factories or offices
Rural-urban migration is mostly internal migration (within a country)
Urbanisation pathway
Countries become more urban as they develop economically
This transition from LICs to HICs can be shown as a pathway over time
The pace through the stages slows and flattens or will decline as counter urbanisation gains speed
Push and pull factors of rural–urban migration
Push factors are the reasons people leave rural areas
These include:
Poverty: lack of jobs and low wages in rural areas
Poor living conditions: limited access to services like healthcare, education, and clean water
Natural disasters: droughts, floods, or other environmental challenges that make farming difficult
Pull factors are the attractions of urban areas that draw people to move there
These include:
Job opportunities: cities often offer more and better-paying jobs, especially in industries, services, and trade
Improved living conditions: access to better healthcare, education, and housing in cities
Social and cultural opportunities: cities provide more entertainment, cultural events, and lifestyle choices
Forced and voluntary migration
Voluntary migration:
When people choose to move to cities for better opportunities or living conditions
Forced migration:
When people are pushed into cities due to circumstances like war, famine, or natural disasters
For example, refugees fleeing conflict in Syria and moving to urban areas in nearby countries such as Turkey and Jordan
De-urbanisation trends
Deurbanisation refers to the reverse process where people move out of cities and back to rural or suburban areas
This can happen due to:
Overcrowding: cities becoming too congested, leading to higher costs of living and poorer living conditions
Improved rural opportunities: development in rural areas offering better services, jobs, and living conditions
Technological changes: with the rise of remote working, people can live in rural areas while working for urban companies
🔍 TOK Tip: Can urban planning solve social inequalities?
📌 Urban Expansion
Suburbanisation is the process where people move from the dense central parts of cities (urban areas) to the less dense, peripheral areas (suburbs)
It involves the expansion of cities into nearby rural or undeveloped areas, creating lower-density residential areas
People often move to the suburbs in search of larger homes, green spaces, and better living conditions away from the congested city centre
What is urban sprawl?
Urban sprawl refers to the uncontrolled expansion of urban areas into surrounding rural land, creating spread-out developments
Urban sprawl is closely related to suburbanisation, as lower-density housing and commercial developments require more land, stretching the boundaries of the city
Sprawl often leads to longer commutes, greater car dependency, and increased demand for infrastructure such as roads and services
Causes of suburbanisation
Desire for more space:
People move to the suburbs for larger homes and gardens
Suburban areas often have more green spaces and parks than city centres
Improved transport links:
Advances in public transport and the widespread use of cars have made commuting from the suburbs to city centres easier
Suburban residents can travel to the city for work, shopping, and leisure
Perception of better quality of life:
Suburbs are often seen as safer, quieter, and better for raising families compared to crowded city centres
Suburban areas may offer better schools and lower crime rates
Rising urban costs:
High costs of housing and living expenses in city centres push people to move to the more affordable suburbs
Traffic congestion and overcrowding in city centres:
City centres are often very busy with people and congested with traffic, making commuting and living in the urban core more difficult
Environmental impacts of urban expansion
Loss of agricultural land and natural ecosystems
Loss of farmland:
As cities expand, they often take over land previously used for agriculture
This reduces the amount of land available for growing food
For example, in Beijing, China, rapid urbanisation has consumed large areas of farmland, leading to concerns about food security
Deforestation:
Urban expansion can lead to the clearing of forests to make way for housing, roads, and businesses
This destroys natural habitats and reduces biodiversity
For example, the growth of São Paulo, Brazil, has resulted in the destruction of parts of the Amazon rainforest
Loss of wetlands and ecosystems:
Expanding urban areas often fill in wetlands, rivers, and lakes, reducing habitats for wildlife and affecting water systems
For example, in Florida, USA, urban sprawl has reduced the size of the Everglades, an important wetland ecosystem
Changes to water quality and river flows
Water pollution:
Increased construction and industrial activities near cities can cause pollution to rivers, lakes, and groundwater
Chemicals from factories, waste from homes, and run-off from roads can contaminate water supplies
For example, the Ganges River in India suffers from severe pollution due to urban growth and industrial waste from several major cities
Altered river flows:
Expanding cities often build dams, divert rivers, or drain wetlands, which changes the natural flow of water
This can lead to flooding or drought in nearby areas
For example, in Las Vegas, USA, the city’s rapid growth has strained the Colorado River, leading to water shortages and environmental issues
Air pollution
Increased traffic and industry:
As cities grow, they generate more air pollution from cars, trucks, and factories
This increases levels of harmful gases like carbon dioxide and nitrogen oxides, contributing to climate change and health problems
For example, Mexico City is known for having high levels of smog and poor air quality due to urban expansion and traffic congestion
Heat islands:
Urban expansion often creates urban heat islands
This is where cities become significantly warmer than surrounding rural areas
This happens because buildings, roads, and other urban surfaces absorb and retain more heat than natural landscapes like forests or grasslands
Air conditioners, vehicles, and industrial activities release additional heat into the environment
Loss of biodiversity
Habitat destruction:
Urban expansion can destroy the natural habitats of plants and animals, leading to a reduction in biodiversity
This puts species at risk of extinction
📌 Urban Planning
Urban planning is the process of designing how land and buildings in a city are used to meet the needs of the population
It focuses on the best way to organise urban space to meet the physical, environmental, commercial, industrial, and social needs of all residents
Effective urban planning ensures that cities grow in an organised and efficient way
This is to prevent issues like overcrowding, pollution, and inadequate infrastructure
Modern urban planning aims to create sustainable urban systems that balance the needs of the population with environmental protection
In this context, sustainability means designing cities so they work well and fairly for people today, while also making sure they can meet the needs of future generations
Factors in sustainable urban planning
Quality and affordable housing:
Ensuring housing is available and affordable to all income levels is key for sustainable development
Integrated public transport systems:
A well-connected, reliable, and environmentally-friendly public transport system reduces the need for cars and lowers pollution
For example, Copenhagen, Denmark, has reduced car use by focusing on bicycle lanes and public transport
Green spaces:
Parks, forests, and other green areas improve air quality, provide recreational spaces, and contribute to the well-being of residents
For example, Brasilia, the capital of Brazil, was designed with a very large linear park running down its centre, promoting a balance between urban development and nature
Security and safety:
Creating safe neighbourhoods with reduced crime rates and effective emergency services
Good lighting, surveillance, and safe public spaces contribute to a secure urban environment
Education and employment:
Providing access to schools, universities, and job opportunities is essential for sustainable cities
Urban systems must plan for education and employment to keep the population economically active
Renewable energy and resources:
Sustainable cities aim to use renewable energy sources like solar or wind power to reduce reliance on fossil fuels
For example, San Francisco, USA, has invested in electric vehicle (EV) charging stations to encourage the use of cleaner energy for transportation
Reuse and recycling of waste:
Sustainable cities focus on reducing waste, reusing materials, and promoting recycling to minimise environmental impact
For example, in Singapore, waste-to-energy plants help recycle waste while producing energy for the city
Energy efficiency:
Buildings in sustainable cities are designed to use energy efficiently, reducing waste and lowering energy costs
Green buildings incorporate insulation, solar panels, and other technologies to minimise energy consumption
Water conservation:
Cities must plan for efficient water use and ensure water conservation practices.
For example, Dubai uses grey water to irrigate its green spaces, conserving fresh water resources
Community involvement:
Successful urban planning involves the local community in decision-making processes
This ensures that the needs and ideas of residents are considered
What is ecological urban planning?
Ecological urban planning treats the city as an ecosystem
This type of urban planning considers the interactions between living (biotic) and non-living (abiotic) components
It focuses on:
Creating balance between urban development and the natural environment
Ensuring cities are sustainable, resilient, and healthy for both humans and wildlife
🔍 TOK Tip: How do political ideologies shape urban development?
Key components of ecological urban planning
Urban ecology
Urban ecology integrates green spaces and natural habitats into city design
This includes parks, allotments, ponds, canals, and other areas that provide habitats for wildlife and improve air quality
Urban farming
Urban farming refers to growing food within cities
This is often done in unused or repurposed spaces
This Includes activities like beekeeping, horticulture, aquaculture, and city farms
For example, New York City has community gardens and rooftop farms that supply fresh produce to local residents
Biophilic design
Biophilic design brings nature into the built environment by incorporating natural elements into architecture
This includes living green walls, rooftop gardens, water features, and the use of natural light
For example, the Bosco Verticale (meaning vertical forest) in Milan, Italy, is a complex of two residential skyscrapers covered in trees and plants, improving air quality and biodiversity
Resilience planning
Resilience planning focuses on designing cities to withstand and adapt to environmental challenges like climate change
This may involve:
Vertical farming to produce food in limited urban spaces
Buildings on stilts to protect from flooding in flood-prone areas
In flood-prone areas, such as theNetherlands, some homes are built to float on water, adjusting to rising and falling water levels
Using natural elements like green roofs and permeable pavements to manage stormwater and reduce flooding
Regenerative architecture
Regenerative architecture aims to not only reduce environmental harm but actively improve the environment
Building skins that clean the air:
Some buildings are designed with special materials or coatings on their exterior walls (known as building skins)
These filter and remove pollutants (e.g. nitrogen oxides) from the air, improving air quality around the building
Renewable energy sources:
Many regenerative buildings use solar panels, wind turbines, or bio-digesters to generate more energy than they consume
They are then able to contribute clean energy back to the energy grid
Bio-digesters:
These systems use organic waste (like food or agricultural waste) to produce biogas
This can be used as a renewable energy source for heating or electricity
They also create natural fertiliser as a by-product
Rainwater capture systems:
Buildings can collect rainwater to be reused for non-drinking purposes, e.g. irrigation or flushing toilets
Individuals who move permanently to a country other than their country of origin.
Ageing Population
A demographic trend where the proportion of people aged 65 and older increases, often due to longer life expectancy and declining birth rates.
Diversifying the Economy
Expanding economic activities across multiple sectors to reduce dependency on a single industry and increase resilience.
Young Dependants
Individuals typically aged 0–14 who rely on the working population for support.
Old Dependants
Individuals typically aged 65 and above who are retired and depend on the working population for support.
Economically Active
People typically aged 15–64 who are part of the labor force, contributing to economic productivity through work.
🧠 Exam Tips:
In population structure questions, use age-based terms precisely and mention dependency ratio if relevant.
For economic diversification, mention its role in sustainability and resilience when elaborating.
📌 Human Population Dynamics
Inputs to human populations: births and immigration
Births and immigration are inputs that contribute to the growth of a population
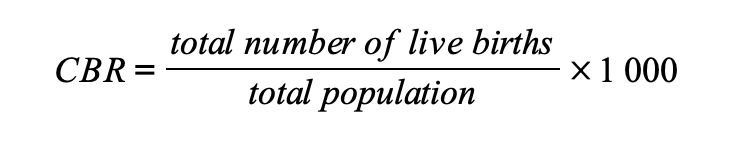
Crude birth rate (CBR):
This is the number of live births per 1 000 people in a population per year
For example, a CBR of 15 means 15 babies are born for every 1 000 people in that population each year
CBR is calculated by dividing the total number of live births in a year by the total population and then multiplying by 1 000
Worked Example
A country has 25 000 live births in a year, and the total population is 500 000.
Calculate the crude birth rate.
Answer
CBR = (number of live births / total population) x 1 000
CBR = (25 000 / 500 000) x 1 000
CBR = 50 births per 1 000 individuals
Immigration rate:
This is the number of immigrants per 1 000 people in a population per year
Outputs from human populations: deaths and emigration
Deaths and emigration are outputs that reduce the size of a population
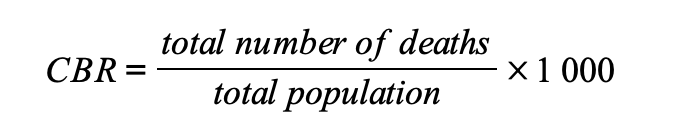
Crude death rate (CDR):
This is the number of deaths per 1 000 people in a population per year
For example, a CDR of 8 means 8 people die for every 1 000 people in that population each year
CDR is calculated by dividing the total number of deaths in a year by the total population and then multiplying by 1 000
Worked Example
In a given year, a country recorded 15 000 deaths, and the total population is 750 000.
Calculate the crude death rate.
Answer
CDR = (number of deaths / total population) x 1 000
CDR = (15 000 / 750 000) x 1 000
CDR = 20 deaths per 1 000 individuals
Emigration rate:
This measures the number of people leaving a population per 1 000 people per year
Quantifying population dynamics
Population growth and decline can be quantified through several key measures:
Total fertility rate (TFR):
This is the average number of children a woman is expected to have during her lifetime, based on current age-specific fertility rates
In developing countries, TFR tends to be higher (e.g. due to limited access to family planning)
TFR is calculated by summing the age-specific fertility rates (ASFR) and multiplying the result by five
Worked Example
A country has the following fertility rates per 1 000 women in each age group:
15-19 years: 20 births per 1 000 women
20-24 years: 85 births per 1 000 women
25-29 years: 100 births per 1 000 women
30-34 years: 80 births per 1 000 women
35-39 years: 40 births per 1 000 women
40-44 years: 10 births per 1 000 women
45-49 years: 2 births per 1 000 women
Calculate the total fertility rate.
Answer
TFR = (20 + 85 + 100 + 80 + 40 + 10 + 2) x 5
TFR = 1 685 births per 1 000 women
TFR = 1.685 children per woman
This means that, on average, a woman in this country is expected to have approximately 1.69 children over her lifetime based on current fertility rates.
Life expectancy:
This is the average number of years a person is expected to live from birth, assuming current demographic factors (such as healthcare) remain the same
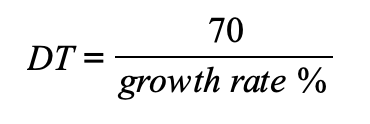
Doubling time (DT):
This is the number of years it would take a population to double in size, based on its current growth rate
DT is calculated using the ‘rule of 70’: divide 70 by the population growth rate percentage
Worked Example
A population has a growth rate of 2% per year.
Calculate the doubling time.
Answer
DT = 70 / growth rate
DT = 70 / 2
DT = 35 years
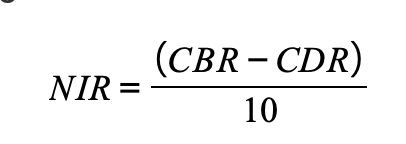
Natural increase rate (NIR):
This is the difference between the crude birth rate and crude death rate, usually expressed as a percentage or a number per 1 000.
If the birth rate is higher than the death rate, natural increase occurs
NIR is calculated by subtracting the CDR from the CBR and then dividing the result by 10
Worked Example
A country has a CBR of 25 births per 1 000 individuals and a CDR of 10 deaths per 1 000 individuals.
Calculate the natural increase rate.
Answer
NIR = (CBR – CDR) / 10
NIR = (25 – 10) / 10
NIR = 1.5%
Rapid growth of the global human population
The global human population has followed a rapid growth curve, particularly in the past century
The global human population grew very slowly until 18th century
From 10 000 BCE to 1700 CE, the average growth rate was just 0.04% per year
There has been exponential growth in the global human population since the mid 18th century
In 1800, the world population was about 1 billion
By 2024, the population will have grown to over 8 billion
This growth is largely due to improvements in medicine, agriculture and technology, which have reduced death rates
The growth rate is starting to fall again
However, the world population is projected to continue to grow until approximately 2100, when it could reach more than 11 billion
UN projection models
The United Nations (UN) uses models to project future global population growth, offering three different scenarios:
High-fertility scenario: assumes higher birth rates will continue, leading to a more rapid population increase
Medium-fertility scenario: assumes a steady decline in fertility rates, leading to moderate population growth (this is the most likely scenario)
Low-fertility scenario: assumes fertility rates will drop significantly, leading to slower growth or a shrinking population
By 2100, the global population is projected to be around 9.7 billion in the medium-fertility scenario
Uncertainty of future fertility rates
Predicting fertility rates is challenging, leading to uncertainty in population forecasts
Changes in cultural norms, economic conditions, and government policies can all influence fertility rates
Countries that went through Industrial Revolutions in the 18th and 19th centuries experienced rapid populationgrowth
Today those countries are developed and their growth rates have fallen
In some cases, they have fallen so much that their total populations are in decline (e.g. Japan)
The fastest population growth today occurs in developing countries that are rapidlyindustrialising
📌 Managing Human Population Growth
Direct management of population growth
Population management involves policies aimed at influencing the size, growth and distribution of human populations
These policies focus on birth rates (pro-natalist or anti-natalist) or on migration (immigration and emigration).
Governments use these policies to address concerns such as:
Overcrowding
Economic demands
Ageing populations
Anti-natalist policies
Anti-natalist policies reduce birth rates in countries with high population growth
These policies are common in countries facing overpopulation, where resources are strained
Methods used
Education and awareness: promoting smaller family sizes and the benefits of fewer children
For example, China’s One-Child Policy (introduced in 1979) aimed to slow population growth by limiting families to one child
Access to contraception: improving the availability of birth control methods to reduce unwanted pregnancies
For example, in India, family planning campaigns have included the distribution of free contraceptives
Financial incentives: offering financial rewards or penalties to influence family size
For example, Vietnam’s Two-Child Policy (introduced in the 1980s) aimed to limit family size by encouraging people to have only two children
The policy was supported by:
Financial penalties for larger families
Incentives such as preferential housing and education benefits for those who complied
Outcomes
Anti-natalist policies lead to:
Slower population growth
Reduced pressure on resources
However, they can also cause long-term issues, such as an ageing population (fewer young people to support the elderly)
Pro-natalist policies
Pro-natalist policies encourage an increase in birth rates in countries with low or negative population growth
These policies are used in countries facing ageing populations or labour shortages
Methods used
Financial incentives: offering parents monetary support for having more children
For example, France’s Code de la Famille (1939) offers cash bonuses, paid parental leave and subsidised childcare to encourage larger families
Parental support: providing benefits such as longer parental leave or free childcare
For example, Sweden offers generous parental leave (up to 480 days shared between both parents) to support family growth
Cultural encouragement: promoting family-friendly values through campaigns or media
Outcomes
Pro-natalist policies help to:
Boost population growth
Ensure a balanced ratio between working-age individuals and the elderly
However, they may take time to show effects and could face cultural resistance
Migration policies
Migration policies manage immigration (inward) and emigration (outward) to influence population size and labour markets
Countries may encourage or restrict migration based on economic needs and population growth goals
Methods used
Open immigration policies: allowing more people to enter the country, particularly if there is a need for workers
For example, Germany has encouraged immigration to offset its declining population and labour shortages
Restrictions on immigration: limiting the number of people who can enter a country to control population growth or preserve jobs for citizens
For example, Australia has a strict immigration policy based on points
This points-based system favours skilled workers
Encouraging emigration: some countries promote emigration to relieve population pressure
Outcomes
Immigration can help to:
Balance an ageing population
Provide labour
Diversify the economy
Emigration can reduce population pressure, but may lead to a ‘brain drain’, where skilled workers leave the country
Indirect management of population growth
Indirect population management involves policies that do not directly aim to control population growth but still affect factors such as birth rates, death rates and migration
These policies focus on economic, social, healthand development areas
These policies indirectly influence population dynamics
Economic policies
Economic policies influence population growth by:
Improving living standards
Changing family planning decisions
In less wealthy societies, families feel economic pressure to have more children because:
Children contribute to family income: in many rural or low-income areas, children may work on farms or help with small businesses, providing extra income for the family
Lack of social welfare: without government support like pensions or healthcare, parents may rely on their children to support them in old age
Higher child mortality rates: in areas with poor healthcare, parents may have more children to ensure that some survive to adulthood
Limited access to education: with fewer opportunities for higher education, children are often seen as a source of immediate labour and support, rather than an investment for the future
Wealthier societies tend to have lower birth rates, as families may prefer to invest more in fewer children
Methods used
Job creation and economic stability: improved employment opportunities can reduce poverty
This leads to fewer children as families focus on education and careers
Welfare systems: governments that provide strong social welfare systems help families feel secure with fewer children
Outcomes
Higher living standards often lead to lower birth rates, as families feel less economic pressure to have many children
Economic development can slow population growth as people focus more on career and lifestyle choices over family size
Social and gender equality policies
Policies that promote gender equality and social development indirectly reduce birth rates
This is because these types of policies empower women to make informed family planning decisions
Methods used
Education for girls and women: increasing access to education leads to delayed marriages and childbirth, as well as smaller family sizes
Workforce participation: encouraging women to join the workforce allows them to focus on careers
This often leads to smaller families and later pregnancies
Outcomes
Improved gender equality leads to more choices for women, resulting in lower birth rates
Societies with greater gender equality have higher levels of education and economic participation, both of which can reduce population growth.
Public health and welfare policies
Health policies affect population growth by lowering death rates and improving overall well-being
Both of these can influence birth rates
Methods used
Improved healthcare: providing better healthcare, especially maternal and child health services, reduces infant mortality
This can lead to smaller family sizes
Outcomes
Better healthcare reduces both death and birth rates, leading to more stable population growth
📌 Population Composition & Modelling
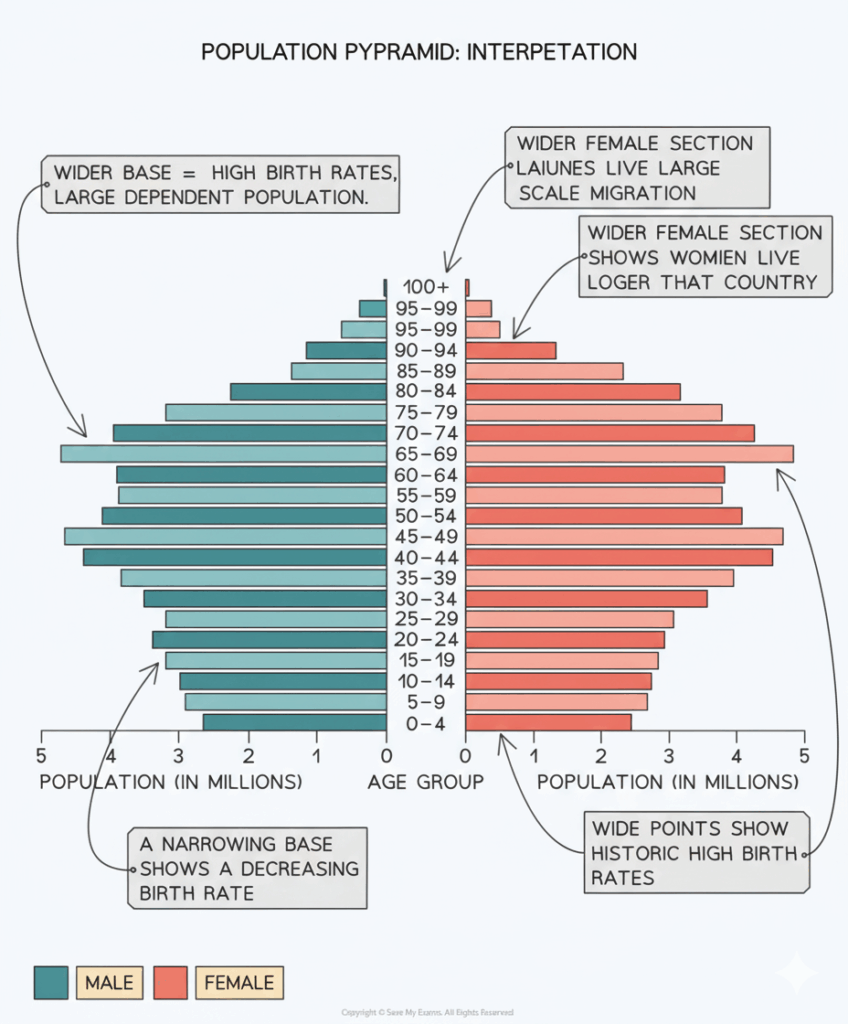
Age-sex pyramids
The composition of human populations can be modelled and compared using age–sex pyramids
These are sometimes referred to as population pyramids, age-gender pyramids or age structure diagrams
An age–sex pyramid is a graphical representation of a population’s ageandsexstructure
It displays the percentage or number of individuals in each age group and gender within a given population
They typically show data for a particular country or region
The age–sex pyramid is usually represented as a horizontal bar graph
The age groups are displayed along the verticalaxis
The percentage or number of individuals in each age group is displayed along the horizontal axis
The left side of the graph displays the male population
The right side shows the female population
The shape of the age–sex pyramid can provide insights into the demographic characteristics of a population
For example, a pyramid with a broad base and a narrow top indicates a young population with high fertility rates and low life expectancy
Whereas a pyramid with a narrow base and a broad top indicates an ageing population with low fertility rates and high life expectancy
Age–sex pyramids are used by policymakers and economists to:
Understand population trends
Forecast future population growth
Plan for social and economic policies
They are also used in fields such as public health, education and social welfare to plan for the needs of specific age groups within a population
This means that governments can estimate and plan for spending
An age–sex pyramid can be used to identify the following groups:
Young dependents
Old dependents
Economically active (working population)
Population structures of LICs and HICs
Low-income countries (LICs) like Niger typically have a concave pyramid shape
This indicates:
High birth rate
Low life expectancy
High death rate
High infant mortality rate
Young dependent population dominates
More developed LICs like Nepal typically have a pyramid shape with a taller base, like the one shown above
This indicates:
Decreasing birth rate
Increasing life expectancy
Decreasing death rate
Decreasing infant mortality
Decreasing young dependents and increasing economically active population
High-income countries (HICs) such as the USA typically have a column shape
This indicates:
Low birth rate
High life expectancy
Low death rate
Low infant mortality
Large working age population
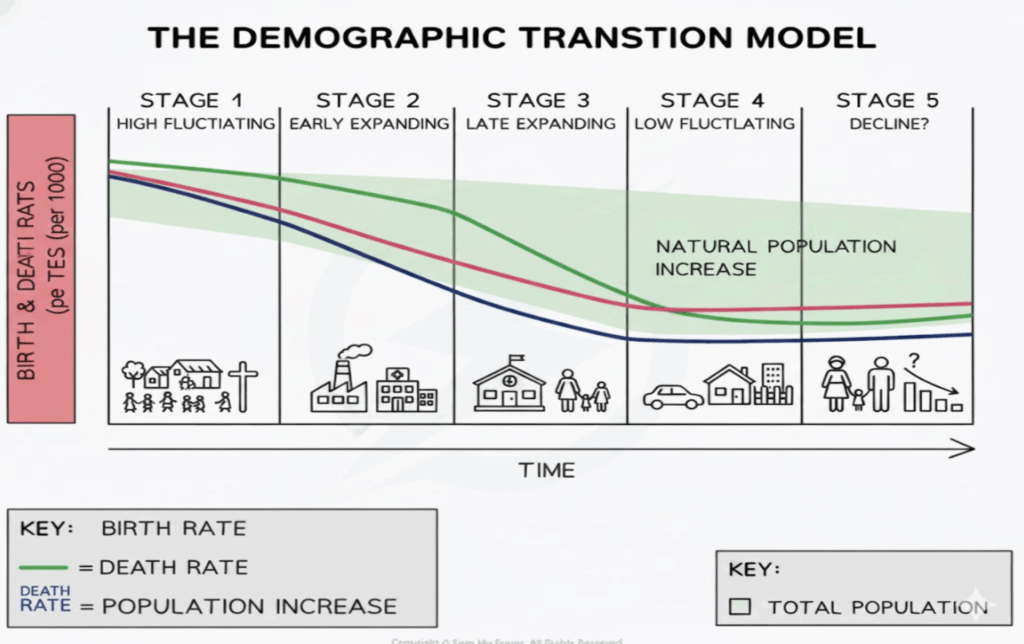
Demographic transition model (DTM)
The DTM is a model that shows how a population transitions over time:
From a pre-industrial stage, with high crude birth rates and high crude death rates
To an economically advanced stage, with low or declining crude birth rates and low crude death rates
The DTM illustrates five generalised stages that countries pass through as they develop
It shows how the birth and death rates change and how this affects the overall population of the country
Stage 1
The total population is low
High birth rates due to lack of contraception and family planning
High death rates due to poor healthcare, poor diet and famine
High infant mortality, which leads people to have more children so that some children survive to adulthood
Stage 2
The total population starts to rise rapidly
Birth rates remain high as people continue to have large families
Death rates decrease as a result of improved diets, better healthcare, lower infant mortality and increased access to clean water
Stage 3
The total population continues to increase but the rate of growth begins to slow
Birth rate begins to fall rapidly due to increased birth control, family planning, increased cost of raising children and low infant mortality rate
Death rate still decreasing but at a slower rate as improvements in medicine, hygiene, diet and water quality continue
Stage 4
The total population is high and is increasing slowly
Birth rate is low and fluctuating due to accessible birth control and the choice of having fewer children as well as delaying the age women start to have children
Death rate is low and fluctuating
Stage 5
The total population starts to slowly decline as the death rate exceeds the birth rate
A system of linear equations is a group of two or more equations that must be satisfied at the same time.
Each solution gives values that work in every equation simultaneously.
Equations can have 2 or 3 variables.
The solution is where all equations intersect.
In exams, there will always be a unique solution.
Example idea:
2x + y = 7
x − y = 1
Technology quickly finds x = 2 and y = 3
🌍 Real-World Connection
Electrical circuit problems (Kirchhoff’s Laws in physics) rely on solving systems of equations to determine currents and voltages.
📌 Polynomial Equations & Roots
A polynomial equation is an equation of the form:
axⁿ + bxⁿ⁻¹ + … + c = 0
The solutions are called the roots or zeros of the function. These are the x-values where the graph crosses the x-axis.
Quadratic → up to 2 roots
Cubic → up to 3 roots
Higher powers → more roots
Manual solving is not required — technology is always used.
📗 GDC Tip
Use Graph → Zero or Poly-Root to find solutions directly.
Always verify roots by substituting them back into the equation.
📌 Interpretation of Solutions
Solutions must always be interpreted in the context of the problem:
Time cannot be negative
Distance cannot be imaginary
Population cannot be fractional in certain models
🔍 TOK Perspective
Mathematics uses words like real and imaginary differently from everyday language — how does language shape how we interpret knowledge?
📌 Exam Expectations
No specific algebraic solving method is required
You must correctly interpret the technology output
Answers should always be checked for context validity
🧠 Examiner Tip
Most errors occur when students accept a root without checking if it makes real-life sense.
📐 IA Spotlight
You can model real systems using polynomial or simultaneous equations:
Motion problems
Break-even analysis
Population models
📝 Paper 1 Strategy
Always:
Write down what the variables represent
Confirm the number of expected solutions
Round only at the final stage
📌 Why This Topic Matters
Used in physics, economics, engineering, AI models
SL 1.7 — Amortization & Annuities Using Technology
Key Term
Simple Description
Present Value (PV)
The value now (loan amount or lump-sum investment).
Payment (PMT)
Regular fixed amount paid or received every period.
Interest Rate (r)
Percentage charged or earned each period.
Number of Periods (n)
Total count of equal time intervals (months, years, etc.).
Future Value (FV)
Value at the end of all payments or interest periods.
📌 What Is an Annuity?
An annuity is a financial situation where equal payments are made at regular intervals, such as every month or every year.
In this syllabus, payments are assumed to be made at the end of each period (an ordinary annuity).
Savings annuity: you regularly deposit money into an account and it grows with interest.
Repayment annuity: you repay a loan in regular instalments (e.g. mortgage, car loan).
🌍 Real-World Connection
Retirement plans, student loans, credit card repayments and phone contracts all rely on annuity ideas.
📌 Amortization of a Loan
To amortize a loan means to pay it off completely by making regular payments that cover:
the interest charged for that period
plus a portion of the original amount borrowed (principal)
At the beginning, a larger share of each payment goes to interest; later payments contain more principal.
Technology (GDC or spreadsheet) is used to work out the fixed payment and, if needed, an amortization table.
Example idea (no hand formula required):
Borrow 200 000 at 6% per year, repaid monthly over 25 years.
Technology finds the monthly payment and can show how much of each payment is interest versus principal.
📐 IA Spotlight
Students can analyse real or simulated loans (credit card, car, housing) and compare the total interest paid under different rates or terms.
📌 Understanding the Time Value of Money
Money now is usually worth more than the same amount later, because it can earn interest.
Annuity calculations balance:
the present value (loan or initial investment)
regular payments (PMT)
interest rate per period
number of periods
future value, often 0 for loans (fully repaid) or positive for investments (target amount)
🔍 TOK Perspective
To what extent is the “value” of money a mathematical fact versus a social agreement affected by inflation and risk?
📌 Using GDC / Spreadsheets for Annuities
In this topic you are not required to memorise the annuity formulas.
Instead, you must be comfortable using technology to set up the correct values.
Select a TVM (Time Value of Money) solver on your GDC, or build a spreadsheet with columns for period, interest and balance.
Enter known values: n, interest rate per period, PV, PMT or FV, depending on the question.
Solve for the missing quantity (usually PMT, n or FV).
Check that the sign convention is consistent: payments (money out) and balances (money in) must have opposite signs.
📗 GDC Tip
Always clear the TVM variables before a new question and check that the interest rate you enter is the rate per period (for example, yearly rate divided by 12 for monthly payments).
📌 Typical Question Types
Find the regular payment needed to repay a loan in a given time.
Find how long it will take to clear a loan with fixed payments.
Find the future value of regular savings into an account.
Compare two loan options with different interest rates or durations.
📝 Paper 1 Strategy
Sketch a quick time line (0, 1, 2, …, n) showing when payments occur.
This helps you decide whether you are dealing with a loan being repaid (PV known, FV = 0) or a savings plan (PV = 0, FV unknown).
📌 Ethical & Real-Life Considerations
Annuities and amortization are not just calculations — they affect real people’s lives.
High interest rates can make repayments unaffordable and lead to long-term debt.
Understanding mathematics can protect people from unfair or misleading financial offers.
Short-term loans with very high rates can appear small per month but create huge total payments.
❤️ CAS Link
Design a workshop for younger students or your community on understanding interest, loans and responsible borrowing.
A logical step-by-step argument showing that a statement must be true.
LHS → RHS Proof
Start from one side of an equation and transform it into the other using algebra.
Identity vs Equality
An identity is always true; an equality may only be true for some values.
📌 What Is a Deductive Proof?
A deductive proof is a logically ordered sequence of algebraic steps that shows why a mathematical statement must be true.
Each step must follow directly from a known rule such as simplification, factorisation, expanding brackets, or cancelling terms.
It does not test with numbers — it proves generally.
Every step must be mathematically justified.
Shortcuts or guessing invalidate the proof.
🌍 Real-World Connection
Logical proof is used in computer programming, cryptography, legal argumentation, and artificial intelligence validation.
📌 LHS → RHS Proof (Left-Hand Side to Right-Hand Side)
In this method, you start only with the left-hand side of the identity and apply algebraic rules until it becomes identical to the right-hand side.
You never assume the RHS is true during the process.
Numerical Example:
1 ÷ 4 + 1 ÷ 12
= 3 ÷ 12 + 1 ÷ 12
= 4 ÷ 12
= 1 ÷ 3
Algebraic Generalisation:
1 ÷ (m + 1) + 1 ÷ (m² + m)
= (m + m + 1) ÷ [m(m + 1)]
= 1 ÷ m
🧠 Examiner Tip
Never write LHS = RHS at the start.
You must demonstrate how LHS becomes RHS through valid algebraic steps.
📌 Algebraic Identity Proof
Example:
(x − 3)² + 5
= x² − 6x + 9 + 5
= x² − 6x + 14
Since both sides match exactly for all values of x, this is an identity.
An identity is true for every possible value.
An equation is only true for specific solutions.
🔍 TOK Perspective
Is mathematical proof more certain than scientific proof, given that no physical experiment is required?
📌 Notation: Equality vs Identity
= means the two expressions are equal for a particular value.
≡ means the two expressions are equal for all values.
Example:
(x − 3)² + 5 ≡ x² − 6x + 14
Since it is always true, not just for some x.
📝 Paper 1 Strategy
If the question says “Show that”,
you must use structured reasoning — numerical checking alone earns zero credit.
📐 IA Spotlight
Proof methods can support algebraic modelling investigations by guaranteeing that transformations preserve correctness.
Rules for multiplying, dividing, and raising powers with whole-number indices.
Logarithms (Base 10 & e)
Inverse operation of exponentiation, used to solve exponential equations.
Technology Use
Required for numerical evaluation of logarithms.
📌 Laws of Exponents (Integer Powers)
Exponent laws simplify calculations involving powers and allow large expressions to be reduced logically.
Multiplication: aᵐ × aⁿ = aᵐ⁺ⁿ
Division: aᵐ ÷ aⁿ = aᵐ⁻ⁿ
Power of a power: (aᵐ)ⁿ = aᵐⁿ
Negative powers: a⁻ⁿ = 1 ÷ aⁿ
Power of a product: (ab)ⁿ = aⁿbⁿ
Worked Examples:
5³ × 5⁻⁶ = 5⁻³ = 1 ÷ 125
6⁴ ÷ 6³ = 6¹ = 6
(2³)⁻⁴ = 2⁻¹²
(2x)⁴ = 16x⁴
2x⁻³ = 2 ÷ x³
🧠 Examiner Tip
Students often forget that negative powers mean reciprocals.
Always rewrite negative powers as fractions before final simplification.
🌍 Real-World Connection
Scientific notation, half-life decay, sound intensity, and light brightness all depend directly on exponent laws.
📌 Introduction to Logarithms (Base 10 and Base e)
Logarithms are the inverse of exponentiation.
They answer the question: “What power do I raise the base to in order to get this number?”
If aˣ = b, then logₐ(b) = x
Base 10: log₁₀(x)
Base e: ln(x)
The argument b must always be > 0.
Meaning of ln(x): The natural logarithm uses base e ≈ 2.718 and appears in growth, decay, finance, and physics.
Examples:
log₁₀(1000) = 3 because 10³ = 1000
ln(e²) = 2
🔍 TOK Perspective
Is the number e discovered through nature or invented as a symbolic system?
Do logarithms exist independently of human definition?
📌 Numerical Evaluation of Logarithms (Technology Required)
Exact values of most logarithms cannot be found manually and must be evaluated using calculators.
log₁₀(2) ≈ 0.3010
ln(5) ≈ 1.609
log₁₀(0.01) = −2
📗 GDC Tip
Always confirm whether your calculator is using log (base 10) or ln (base e).
Using the wrong base is a common exam mistake.
📐 IA Spotlight
Strong IA themes include modelling sound levels, earthquakes, pH chemistry, population growth, or financial inflation using exponential and logarithmic functions.
📌 Applications of Exponents & Logarithms
Richter scale (earthquake intensity)
Decibel scale (sound intensity)
pH scale (acidity)
Exponential population growth and radioactive decay
🌍 Real-World Connection
Every 1-unit increase on the Richter scale represents a 10× increase in earthquake strength, not a simple additive change.
Logarithms help compare events whose sizes differ by many orders of magnitude.
📝 Paper 1 Strategy
Whenever possible, simplify using exact exponent laws
before substituting numerical values.
This often earns method marks even if rounding errors occur later.


