| Term / concept | Definition / short explanation |
|---|---|
| Spearman’s rank correlation (rs) | Non-parametric measure of the strength and direction of a monotonic relationship between two variables based on ranks (range −1 to +1). |
| Rank difference (d) | For each pair, d = (rank of X) − (rank of Y). Used in the standard formula rs = 1 − (6 Σ d2) / (n (n2 − 1)) when no ties are present. |
| Ties | Equal values receive the average of the ranks they occupy. Ties require tie-adjusted methods (use technology for accuracy). |
📌 1. What rs measures and when to use it
- Definition: rs measures the degree to which two variables move together in a monotonic way using their ranks rather than raw values.
- Use when: data are ordinal, relationship is monotonic (not necessarily linear), or when outliers / non-normality make Pearson’s r unreliable.
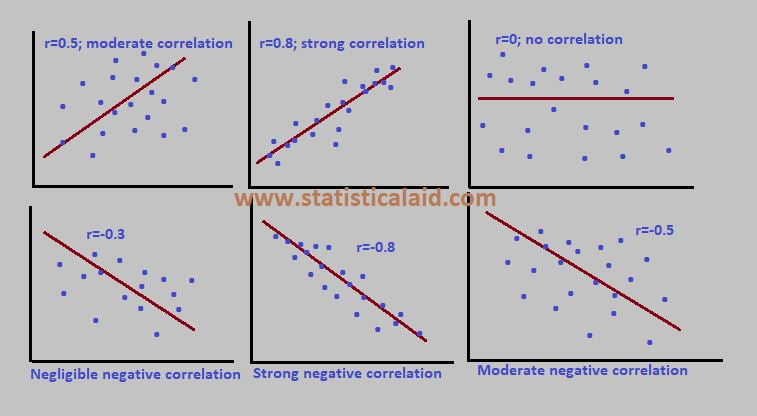
- Interpretation: rs ≈ +1 strong monotonic increase; ≈ −1 strong monotonic decrease; ≈ 0 no monotonic association.
🌍 Real-World Connection
rs is common in survey analysis (Likert-scale responses), ecology (rank abundance), and other fields where the data naturally come as ranks or where robustness to extremes matters.
📌 2. Step-by-step computation (explicit)
- Rank X values from 1 to n (smallest = 1). Average ranks for ties.
- Rank Y values the same way.
- Input the ranks for each value in the order of the normal values in your GDC table menu
- Calculate the Linear Regression of the model and use the r value to show correlation.
📐 IA spotlight
- For an IA choose ordinal or ranked data (e.g., customer preference ranks). Show hand-ranking for a subset, then use GDC for the full dataset and discuss ties and limitations.
Worked example (no ties)
Observations (n = 6):
X: 10, 20, 30, 40, 50, 60
Y: 8, 25, 22, 49, 53, 48
Ranks: Rx = 1,2,3,4,5,6. Ry = 1,3,2,5,6,4. Then d and d2 computed and Σ d2 = 8.
Substitute: rs = 1 − (6 × 8) / (6 (62 − 1)) = 1 − 48 / 210 ≈ 0.771 → strong positive monotonic association.
📌 3. Interpreting results & practical checks
- Magnitude: use context & sample size: |rs| > 0.8 often strong, 0.5–0.8 moderate, 0.3–0.5 weak, below 0.3 negligible (guideline).
- Direction: sign tells increase/decrease in ranks.
- Statistical significance: compute p-value using technology and interpret in context — small n reduces power.
- Ties & robustness: rs is less sensitive to extreme values or outliers than Pearson’s r but many ties reduce discrimination and require tie-corrected methods.
📝 Paper 1 Strategy
- State method: explicitly say “Spearman’s rank correlation (rs)” and justify why it is chosen (ordinal / monotonic / robust to outliers).
- Show ranks & Σ d2: if doing by hand show ranking steps (including average ranks for ties) — method marks are awarded even if numeric slip occurs later.
- Interpret in context: one clear sentence: “rs ≈ 0.77 indicates a strong positive monotonic association; p = … (if given) shows whether association is statistically significant.”
📌 4. Limitations & when not to use rs
- Non-monotonic relationships: if relationship is curved (e.g., U-shape) rs may be near zero despite a clear association — use scatterplots first.
- Large number of ties: reduces effective variability — prefer other analyses or use technology with tie corrections.
- Causation: rs measures association only — it does not establish cause.
🔍 TOK Perspective
Consider how the choice of measure (Pearson vs Spearman) affects knowledge claims. What assumptions are hidden when we assert “strong correlation”?
🌐 EE Focus
An EE could compare rank-based correlations across countries (e.g., GDP rank vs life-satisfaction rank), discussing data quality, ties, and interpretation challenges.
📌 Quick checklist before submitting
- Have you shown ranks (and average ranks for ties) or stated you used technology?
- Did you compute Σ d2 clearly and substitute into the formula (or state GDC was used)?
- Did you include a contextual interpretation and mention statistical significance if asked?