In AIHL Mathematics, confidence intervals are used to estimate an unknown population mean using sample data.
You must choose the correct distribution (normal or t), construct the interval using your GDC, and
interpret the interval in context to answer “is there evidence that…” questions..
| Term / concept | Definition / explanation |
|---|---|
| Population mean (μ) | The true average value of a variable for the entire population (usually unknown and what we want to estimate). |
| Sample mean (x̄) | The average of the observed sample values. It is our point estimate for μ. |
| Known σ vs unknown σ | If the population standard deviation σ is known, we use the normal distribution (z-interval). If σ is unknown, we use the sample standard deviation s and the t-distribution (t-interval). |
| Confidence level | Percentage (for example 95%) describing how often intervals constructed by this method will capture the true mean in the long run. |
| Confidence interval | An interval of plausible values for μ, centred at x̄ with width determined by variability, sample size and chosen confidence level. |
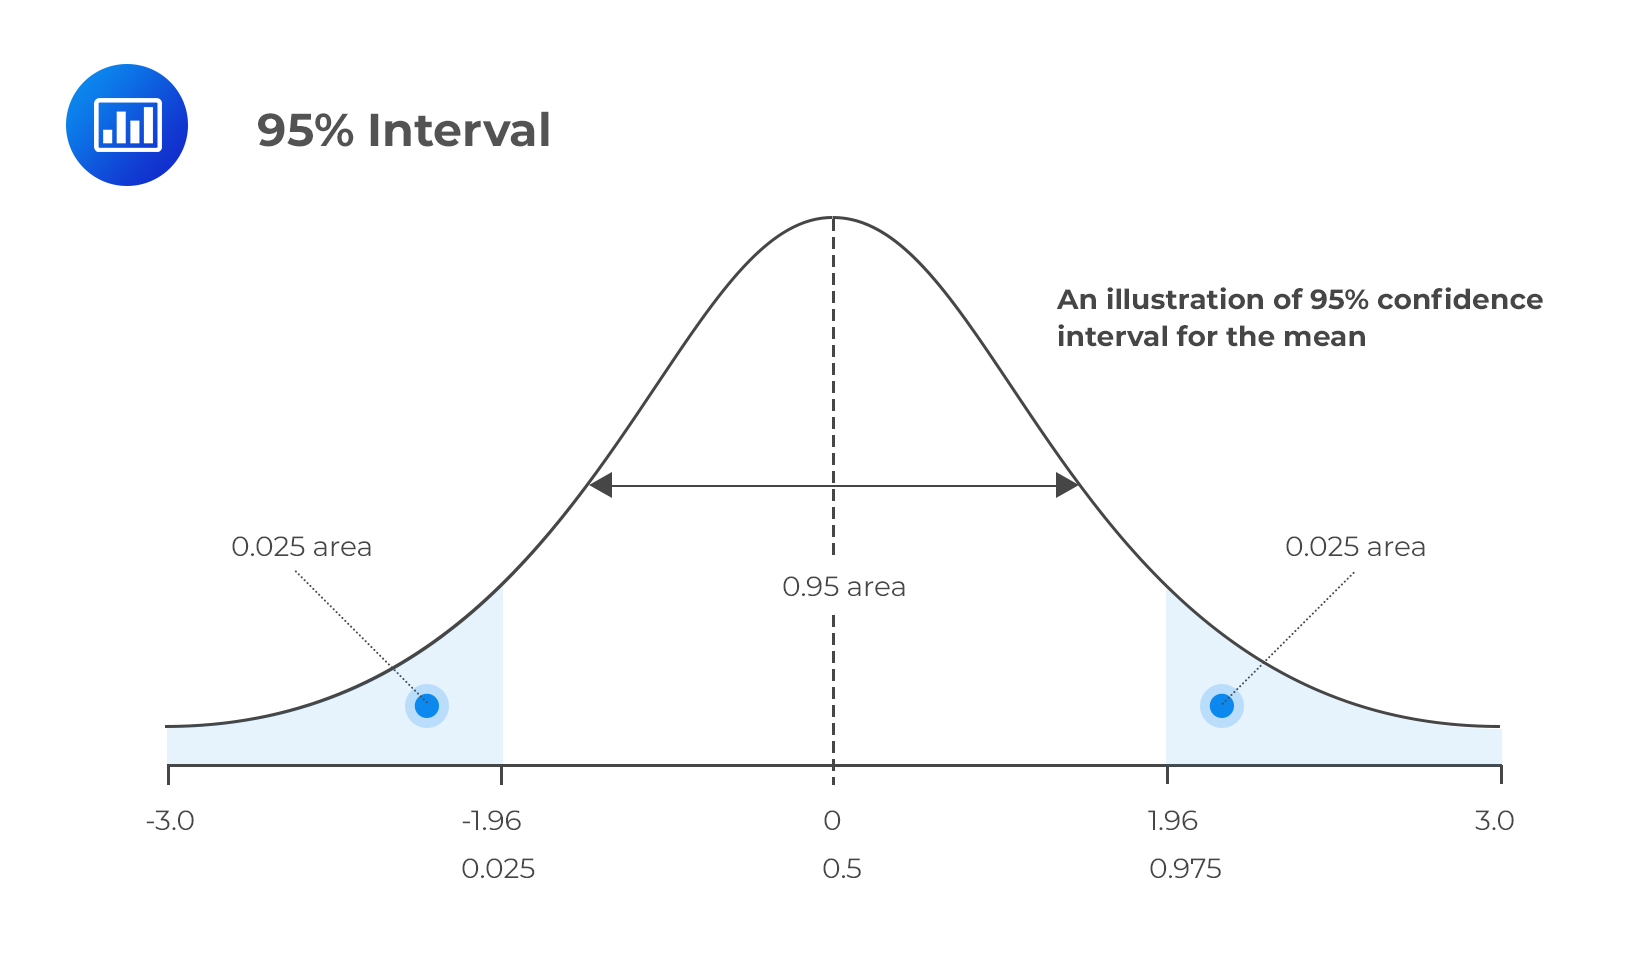
📌 1. Idea of a confidence interval
A confidence interval for μ is not “the probability that μ lies in this interval”.
Instead, it is constructed by a method that, in repeated sampling, would capture μ
the stated proportion of the time. For a 95% interval:
- We take one sample and compute x̄ and either σ (known) or s (unknown).
- The GDC uses the sampling distribution of x̄ to create x̄ ± margin of error.
- If we repeated this process many times, about 95% of such intervals would contain μ.
🌍 Real-World Connection
Opinion polls report intervals (“support for candidate A is 52% ± 3% at 95% confidence”).
In AIHL problems, confidence intervals for means are used in exactly the same way to quantify
uncertainty about average height, reaction time, yield, or score.
📌 2. Confidence intervals for μ when σ is known (normal distribution)
When the population is normal and σ is known, or when n is large and σ is known from previous studies,
the sampling distribution of x̄ is normal with mean μ and variance σ2/n.
Your GDC uses this to compute a z-interval.
Typical AIHL question type
- “Given n, x̄ and known σ, find a 95% confidence interval for the mean.”
- “Use the interval to comment on whether μ could be equal to some claimed value.”
Example 1 — Known σ, construct and interpret a 95% interval (use GDC)
A machine fills cereal boxes. The mass in grams follows a normal distribution with known standard deviation
σ = 4. A random sample of 40 boxes has mean mass x̄ = 502 grams.
- (a) Find a 95% confidence interval for the true mean mass μ.
- (b) The advertised mass is 500 g. Comment on whether the data are consistent with this.
GDC method (z-interval):
- On most TI models: press STAT → arrow to TESTS → choose
ZInterval. - Select Stats (not Data) because you already have summary values.
- Enter σ = 4, x̄ = 502, n = 40, C-Level = 0.95.
- Choose Calculate. The display gives an interval, for example
(500.7, 503.3) (values will depend on rounding used by your model).
Answer (a): 95% confidence interval for μ is approximately (500.7, 503.3) grams.
Answer (b): 500 g lies inside this interval, so the data are
consistent with the advertised mass. There is no evidence that the mean is different from 500 g.
🧠 Examiner Tip
- Always state which distribution you are using (normal or t) and
why (σ known or unknown). - Write the GDC output interval and then interpret it in context
(“we are 95% confident that…”). - If asked about a claimed value, say whether it lies inside or outside the interval, and link that to
“consistent with data” vs “evidence against the claim”.
📌 3. Confidence intervals when σ is unknown (t-distribution)
When σ is unknown, we estimate it by the sample standard deviation s.
For a normal population, or for reasonably large n, the sampling distribution of
(x̄ − μ) / (s / √n) follows a t-distribution with n − 1 degrees of freedom.
Your GDC uses this to construct a t-interval.
Typical AIHL question type
- “Raw sample data from a normal population are given: construct a 95% confidence interval for the mean.”
- “Use your interval to discuss whether a new method has increased the mean compared with a known baseline.”
Example 2 — Unknown σ, t-interval and “improvement” question (use GDC)
A researcher tests a new revision course. Exam scores (out of 100) for 12 students who took the course are:
63, 71, 68, 74, 70, 77, 69, 73, 75, 66, 72, 78.
Assume scores are normally distributed.
- (a) Use your GDC to find a 95% confidence interval for the mean score μ of students taking the course.
- (b) Previous classes without the course had mean 68. Does the interval suggest an improvement?
GDC steps (t-interval from raw data):
- Enter the data in a list (for example, L1): use STAT → Edit and type the 12 scores.
- Press STAT → TESTS → TInterval (or “1-Sample tInt” / similar on your model).
- Choose Data (not Stats) since you have raw data.
- Set List to L1, Freq to 1, C-Level to 0.95.
- Select Calculate. The GDC displays the interval (L, U), plus x̄, s and n.
Suppose your calculator reports, for example, x̄ ≈ 71.8, s ≈ 4.7 and
95% confidence interval (69.0, 74.6). (Exact values depend on rounding.)
Answer (a): 95% confidence interval for μ is approximately (69.0, 74.6).
Answer (b): The old mean 68 lies below the entire interval.
This suggests that the new course has increased the mean score; the data provide evidence of an improvement.
📐 IA Spotlight
For an IA involving data collection, you can report your sample mean together with a confidence interval,
explaining clearly how the interval was obtained using your GDC. Discuss whether a claimed value or target
lies inside the interval and how that affects your conclusion.
📌 4. Interpreting and comparing confidence intervals
AIHL exam questions often ask for more than just the interval; they require interpretation.
Key interpretation pointers
- Always link back to the context (“mean mass of cereal”, “mean exam score”, “mean reaction time”).
- If a hypothesised value lies inside the interval, the data are consistent with that value.
- If you compare two groups and their intervals largely overlap, differences in means may be
statistically weak; if intervals do not overlap, there is stronger evidence for a difference.
🔍 TOK Perspective
Confidence intervals attach uncertainty to statements such as “brand A is better on average than brand B”.
If the intervals overlap significantly, how strong is the knowledge claim that one brand is better?
What role does statistical uncertainty play in real-world decision making?
📝 Paper 2 Strategy
- Use your GDC’s ZInterval or TInterval function; do not try to
compute critical values by hand unless the question explicitly asks you to. - Copy the interval from the screen to your working and round sensibly
(usually to 3 significant figures or as the question specifies). - Write one or two sentences interpreting the interval and reacting to any claim in the question;
many marks are for communication and reasoning, not just button pressing.
❤️ CAS Idea
Run a small study in your school (for example, average time to solve a puzzle) and construct a confidence interval
for the mean using students’ data. Present your findings with an explanation of what “95% confidence” really means.
📌 Confidence Intervals — IB AIHL Practice Questions
Short-answer questions
1. Explain clearly what is meant by a “95% confidence interval for the population mean μ”.
Answer
A 95% confidence interval for μ is an interval constructed using sample data such that, in the long run,
95% of intervals produced by this method will contain the true population mean μ.
It does not mean there is a 95% probability that μ lies in this specific interval; instead, μ is fixed
and the interval varies from sample to sample.
2. State two conditions under which it is appropriate to use a t-confidence interval instead of a normal (z) confidence interval.
Answer
A t-confidence interval should be used when the population standard deviation σ is unknown and must be
estimated using the sample standard deviation s. Additionally, the sample should come from a normally
distributed population or have a sufficiently large sample size for the Central Limit Theorem to apply.
Long-answer questions
3. A random sample of 36 observations from a normal population has mean x̄ = 72 and known standard deviation σ = 6.
- (a) Find a 95% confidence interval for the population mean μ.
- (b) State whether the data are consistent with the claim μ = 70.
Solution
(a) Since σ is known, a normal (z) confidence interval is appropriate.
The standard error is σ/√n = 6/√36 = 1.
For a 95% confidence interval, z = 1.96.
Confidence interval = x̄ ± z(σ/√n) = 72 ± 1.96(1) = (70.04, 73.96).
(b) The value 70 lies slightly below the lower bound of the interval.
Therefore, at the 5% significance level, the data provide evidence against the claim that μ = 70.
4. A sample of 15 observations from a normal population has sample mean x̄ = 105 and sample standard deviation s = 8.
- (a) Explain why a t-distribution should be used.
- (b) Construct a 95% confidence interval for μ.
- (c) Interpret the interval in context.
Solution
(a) The population standard deviation σ is unknown and the sample size is relatively small (n = 15),
so the t-distribution with n − 1 = 14 degrees of freedom must be used.
(b) The standard error is s/√n = 8/√15 ≈ 2.07.
For 95% confidence and 14 degrees of freedom, t ≈ 2.145.
Confidence interval = 105 ± 2.145(2.07) ≈ (100.6, 109.4).
(c) We are 95% confident that the true population mean μ lies between 100.6 and 109.4.
In repeated sampling, approximately 95% of intervals constructed in this way would contain μ.
5. Explain the relationship between confidence intervals and hypothesis tests for the population mean at significance level α = 0.05.
Explanation
A two-sided hypothesis test at significance level α = 0.05 is directly linked to a 95% confidence interval.
If the hypothesised value of μ lies outside the 95% confidence interval, the null hypothesis would be rejected
at the 5% level. Conversely, if the hypothesised value lies inside the interval, there is insufficient evidence
to reject the null hypothesis. This equivalence allows confidence intervals to be used as an alternative
decision-making tool to formal hypothesis testing.