AHL 2.8 — TRANSFORMATIONS OF GRAPHS
| Transformation Type | General Form | Effect on Graph |
|---|---|---|
| Vertical Translation | y = f(x) + b | Shifts graph up or down |
| Horizontal Translation | y = f(x − a) | Shifts graph left or right |
| Reflection | y = −f(x), y = f(−x) | Flips graph over axis |
| Stretch/Compression | y = p·f(x), y = f(qx) | Scales graph vertically or horizontally |
📌 Understanding Transformations
- The base function y = f(x) represents the original untransformed graph, which acts as the reference shape before any movement, stretching, shrinking, or reflection is applied to it.
- A transformation is a mathematical operation that moves or reshapes a graph while preserving its fundamental structure, such as translations, reflections, and stretches.
- The coordinate axes remain fixed and invariant during transformations, meaning all movements are measured relative to these stationary reference lines.
- Translations are often written using vector notation (a, b), where a controls horizontal motion and b controls vertical motion of the entire graph.
📌 Translations — Shifting Graphs
- The transformation y = f(x) + b moves every point on the graph vertically by b units, upward if b is positive and downward if b is negative.
- Example: y = x² + 4 moves the parabola four units upward without altering its width or orientation.
- The transformation y = f(x − a) moves the graph horizontally, shifting it right by a units if a is positive and left by a units if a is negative.
- Example: y = √(x − 2) shifts the square-root graph two units to the right.
- The combined transformation y = f(x − a) + b applies both shifts using the translation vector (a, b).
- Example: y = (x − 3)² − 2 shifts the parabola three units right and two units downward.
🌍 Real-World Application:
Translations are used in economics to shift supply and demand curves under taxation, subsidies, or cost changes, allowing economists to model how prices move in response to real market forces.
Translations are used in economics to shift supply and demand curves under taxation, subsidies, or cost changes, allowing economists to model how prices move in response to real market forces.
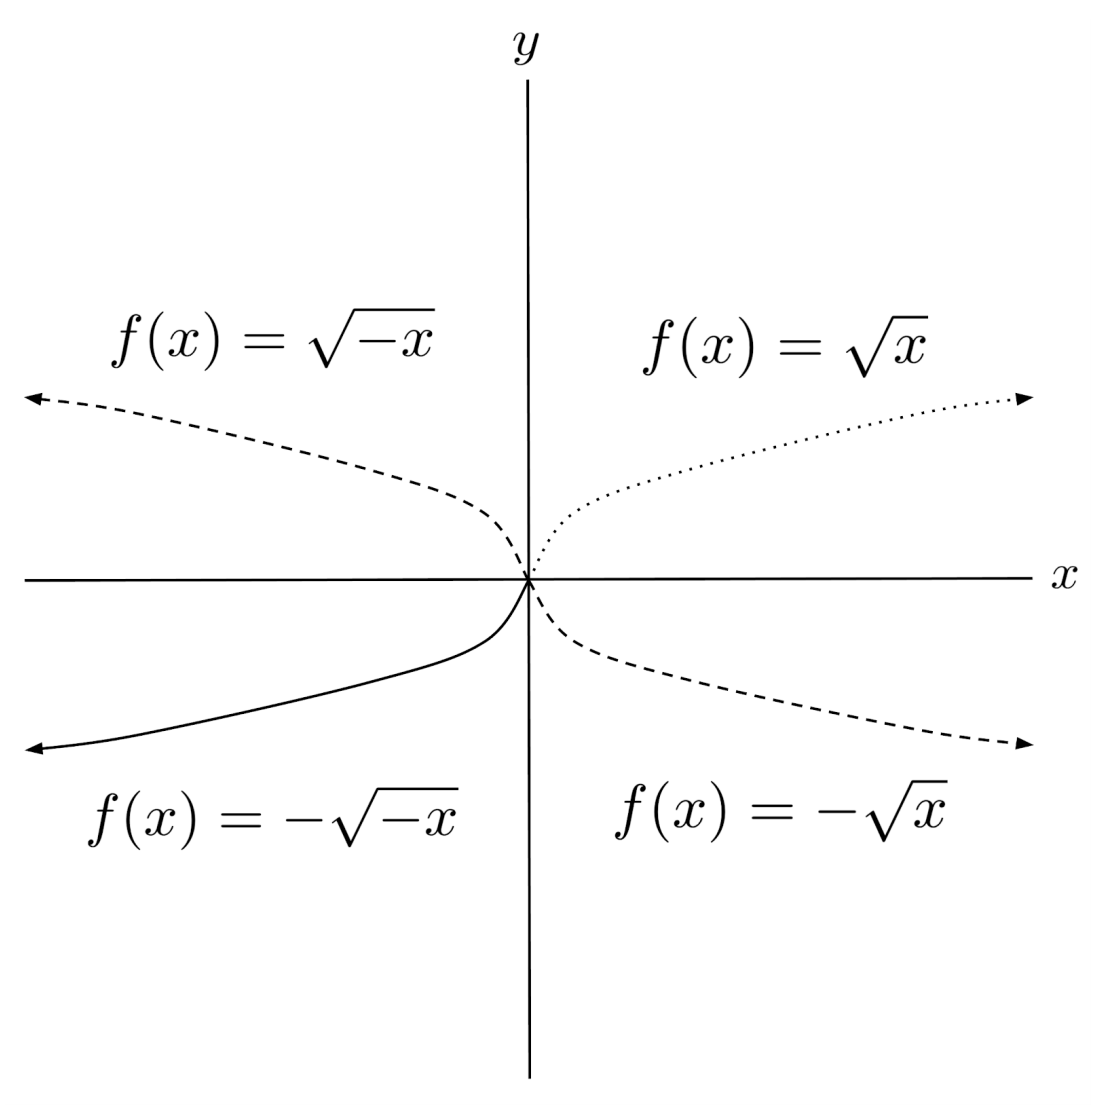
📌 Reflections — Flipping Graphs
- The graph y = −f(x) reflects the original curve across the x-axis, reversing all vertical values while preserving horizontal positions.
- Example: y = x² becomes y = −x², changing an upward-opening parabola into a downward-opening one.
- The transformation y = f(−x) reflects the graph across the y-axis, producing a horizontal mirror image of the original curve.
- Example: y = eˣ becomes y = e⁻ˣ, reversing its growth direction while maintaining exponential behavior.
reflections-of-functions-1.png
📌 Stretches — Scaling Graphs
- Vertical stretches are written as y = p·f(x), multiplying all y-values by p, which changes amplitude or vertical height without altering the x-structure.
- Example: y = 2 sin x doubles the wave’s amplitude while keeping the same period.
- Horizontal stretches take the form y = f(qx), compressing the graph horizontally when q > 1 and stretching it when 0 < q < 1.
- Example: y = sin(2x) halves the original period of the sine curve.

Compression-and-Stretching-1.webp
🔢 Technology Connection:
Dynamic geometry software like GeoGebra and Desmos allows students to apply real-time transformations using sliders, making changes in amplitude, period, and translations immediately visible and intuitive.
Dynamic geometry software like GeoGebra and Desmos allows students to apply real-time transformations using sliders, making changes in amplitude, period, and translations immediately visible and intuitive.
📌 Composite Transformations — Multiple Changes
- Composite transformations involve applying more than one transformation sequentially, producing graphs that combine stretching, reflection, and translation together.
- The order of transformations is critical: horizontal changes inside f( ) must always be applied before vertical transformations outside f( ).
- Example: y = x² → y = 3x² applies a vertical stretch of factor 3 → y = 3x² + 2 shifts the graph upward two units.
- Example: y = sin x → y = 4 sin(2x) doubles frequency and quadruples amplitude.
🧠 Examiner Tip:
Students frequently lose marks by reversing horizontal shift directions. Always remember: x − a shifts right, x + a shifts left. Clearly writing transformation steps and showing vector notation can recover method marks.
Students frequently lose marks by reversing horizontal shift directions. Always remember: x − a shifts right, x + a shifts left. Clearly writing transformation steps and showing vector notation can recover method marks.
📌 Common Misconceptions
- Horizontal transformations behave opposite to intuition, meaning y = f(x − 2) shifts right rather than left.
- Vertical transformations behave intuitively, meaning y = f(x) + 3 always shifts upward by three units.
- Altering the order of composite transformations can completely change the final position and shape of the graph.
📐 IA Spotlight:
Investigating how parameters affect motion graphs, economic demand curves, or sound waves using transformations provides excellent opportunities for variable analysis, modeling accuracy, and graphical interpretation.
Investigating how parameters affect motion graphs, economic demand curves, or sound waves using transformations provides excellent opportunities for variable analysis, modeling accuracy, and graphical interpretation.
❤️ CAS Connection:
Students can design artistic mirror installations demonstrating reflections or translation geometry using interactive movement, helping younger students visualize transformation behavior physically.
Students can design artistic mirror installations demonstrating reflections or translation geometry using interactive movement, helping younger students visualize transformation behavior physically.
🔍 TOK Perspective:
If transformations depend on human-chosen directions and coordinate axes, to what extent can mathematical models truly be considered universal representations of physical reality?
If transformations depend on human-chosen directions and coordinate axes, to what extent can mathematical models truly be considered universal representations of physical reality?