D4.3.1 EVIDENCE FOR CLIMATE CHANGE
📌Definition Table
| Term | Definition |
|---|---|
| Climate change | Long-term shifts in temperature, precipitation, and weather patterns driven by natural and anthropogenic factors. |
| Greenhouse gases (GHGs) | Gases like CO₂, CH₄, N₂O, and water vapour that trap heat in the Earth’s atmosphere. |
| Proxy data | Indirect evidence (ice cores, tree rings, sediments) used to reconstruct past climate. |
| Anthropogenic | Human-induced changes to Earth systems, especially climate. |
| Radiative forcing | Difference between incoming solar radiation and outgoing infrared radiation, altered by GHGs. |
| Feedback mechanisms | Processes that amplify (positive feedback) or reduce (negative feedback) climate change effects. |
📌Introduction
The reality of modern climate change is supported by multiple independent lines of evidence. Instrumental records show rising global temperatures, while proxy data demonstrate that current warming is unprecedented in recent millennia. Greenhouse gas concentrations have increased dramatically due to human activity since the Industrial Revolution, altering Earth’s energy balance. Evidence is strengthened by physical indicators such as melting glaciers, sea-level rise, and shifting weather patterns. Together, these show that anthropogenic climate change is real, measurable, and accelerating
📌 Instrumental and Proxy Evidence
- Instrumental records: consistent global temperature rise of ~1.1 °C since 1850.
- CO₂ monitoring (Keeling Curve): steady increase from ~280 ppm (pre-industrial) to >420 ppm today.
- Ice cores: trapped air bubbles reveal CO₂ and CH₄ fluctuations over 800,000 years; current levels exceed natural cycles.
- Tree rings & sediments: provide high-resolution records of past climates.
- Satellite data: confirm shrinking Arctic sea ice and changing albedo.
🧠 Examiner Tip: Always mention both proxy and direct evidence to demonstrate a complete understanding of climate science data.
📌 Physical Indicators of Change
- Glacial retreat: mountain glaciers shrinking globally.
- Sea level rise: ~20 cm since 1900 due to thermal expansion + ice melt.
- Polar ice sheets: accelerating mass loss from Greenland and Antarctica.
- Ocean warming: >90% of excess heat absorbed by oceans.
- Extreme weather: increased frequency of heatwaves, droughts, and intense storms.
🧬 IA Tips & Guidance: Students can analyse publicly available climate datasets (e.g., NASA GISS temperature anomalies) to test hypotheses on warming trends.
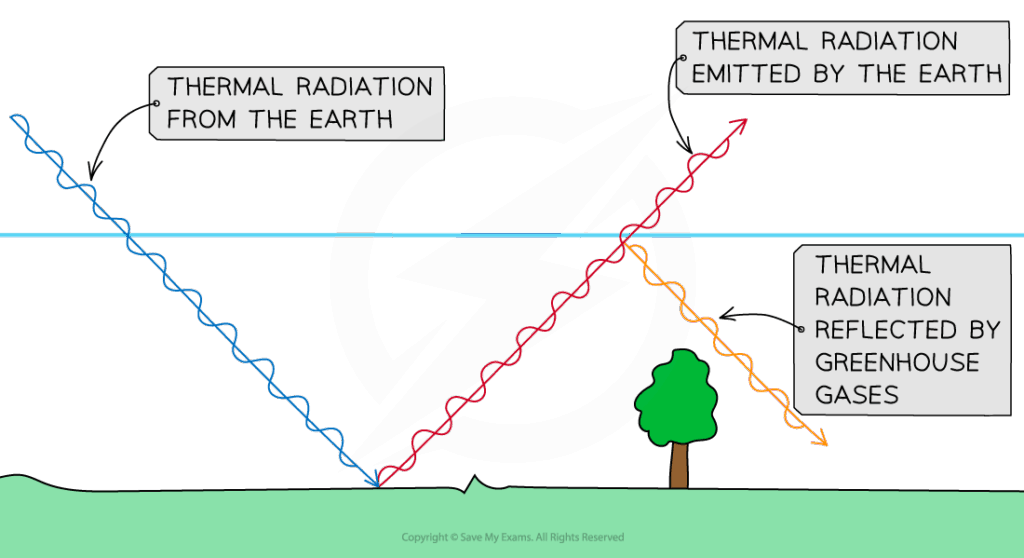
📌 Greenhouse Effect and Radiative Forcing
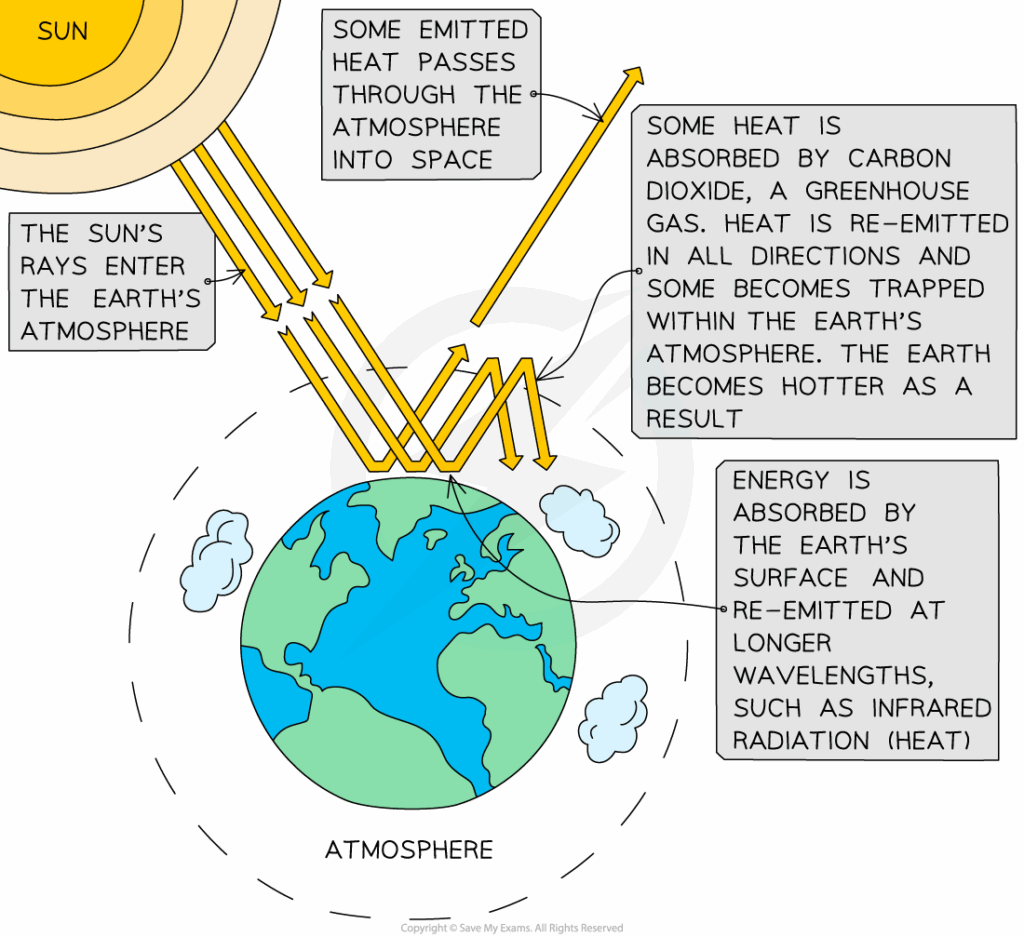
- Natural greenhouse effect essential for life (~33 °C warmer).
- Enhanced greenhouse effect caused by anthropogenic GHG emissions.
- CO₂: fossil fuel combustion, deforestation.
- CH₄: agriculture, livestock, landfills.
- N₂O: fertilisers and industrial processes.
- Positive feedbacks: melting ice reduces albedo; thawing permafrost releases methane.
🌐 EE Focus: An EE could investigate reliability of proxy climate data (tree rings vs ice cores) or model radiative forcing impacts of different greenhouse gases.
📌 Consensus and Uncertainty
- 97% of climate scientists agree on anthropogenic warming.
- Models accurately reproduce observed warming only when human emissions are included.
- Uncertainty exists in predicting regional effects and feedback strength.
- Distinction between short-term variability (El Niño, volcanic eruptions) and long-term trends.
- Scientific consensus strengthens robustness of evidence.
❤️ CAS Link: Students could create awareness campaigns presenting local climate change evidence, e.g., rainfall shifts or heat records, linking global issues to local data.
🌍 Real-World Connection: Evidence for climate change underpins international agreements like the Paris Accord and informs policy on energy, transport, and conservation.
📌 Integration of Evidence
- Multiple independent indicators all point to anthropogenic warming.
- Robustness lies in convergence of datasets across disciplines.
- Evidence links atmospheric chemistry, physics, and ecology.
- Understanding past climates helps predict future trends.
- Strong basis for global action on climate change.
🔍 TOK Perspective: Climate models rely on proxies and simulations. TOK issue: How do we decide what counts as reliable evidence when direct observation over long timescales is impossible?