C4.1.1 POPULATION DYNAMICS GROWTH, DENSITY, DISTRIBUTION
📌Definition Table
| Term | Definition |
|---|---|
| Population | A group of individuals of the same species living in the same area at the same time. |
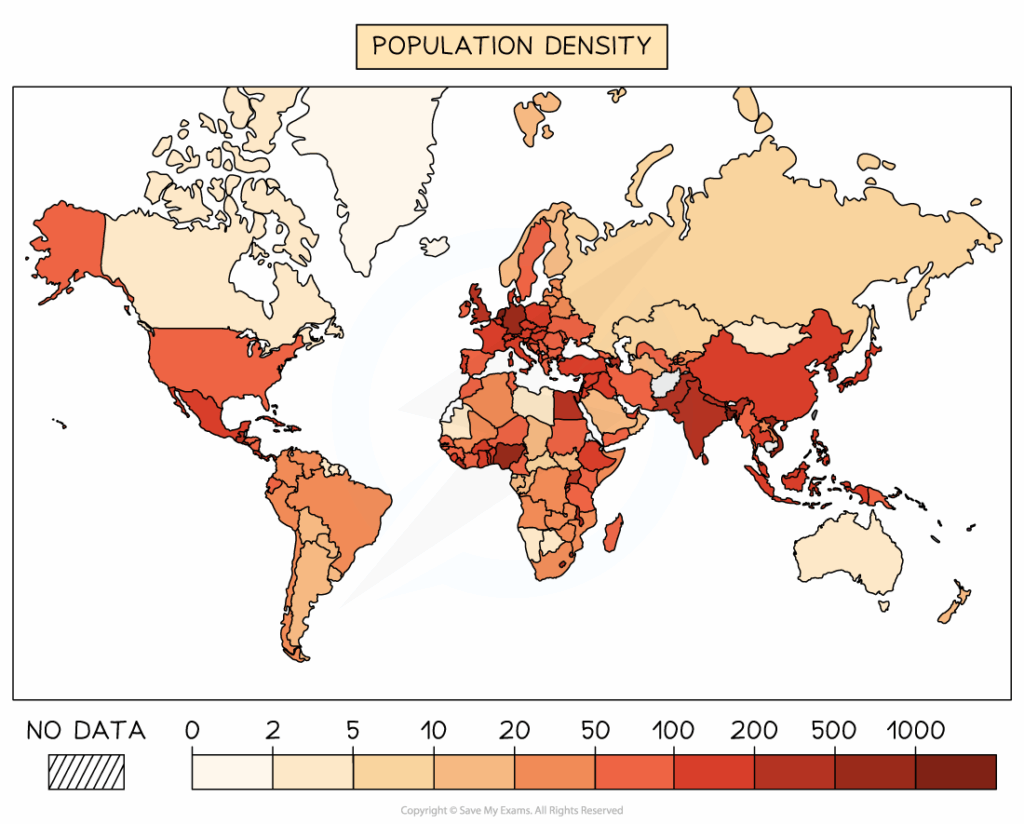
| Population density | The number of individuals per unit area or volume. |
| Population growth rate | The change in the number of individuals in a population over time. |
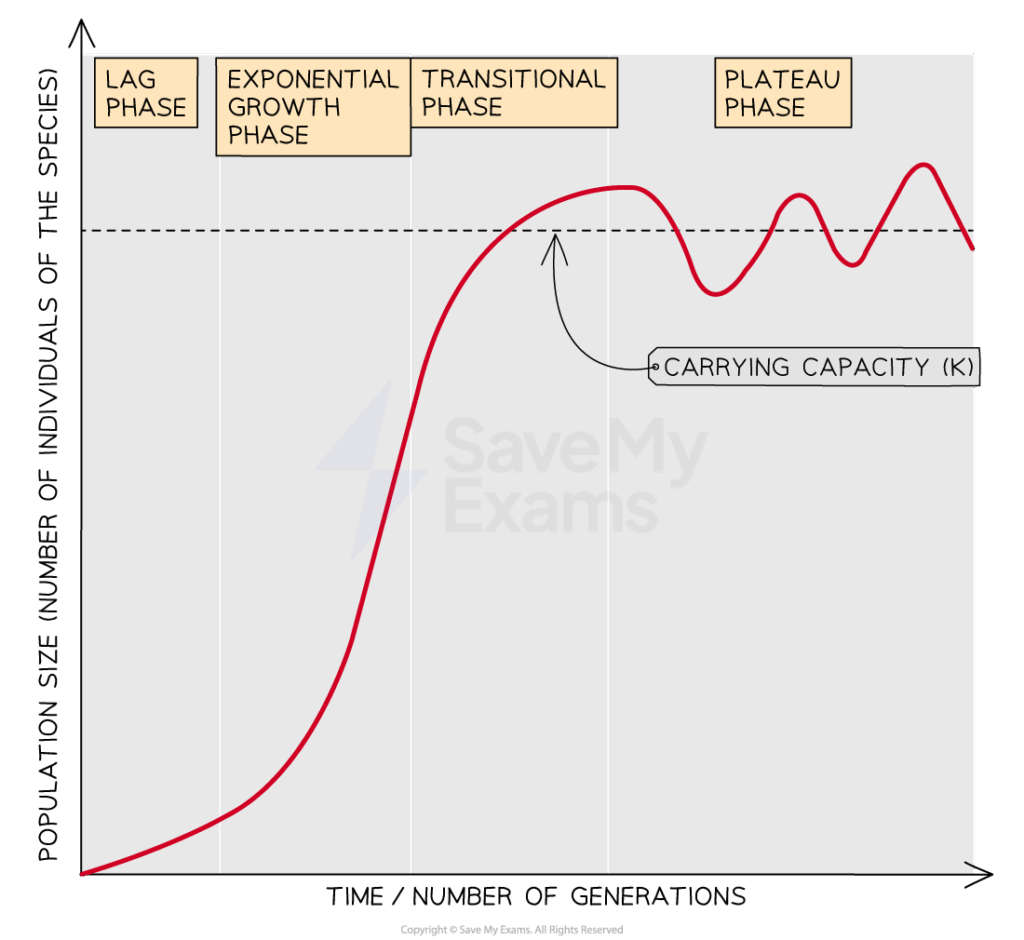
| Carrying capacity (K) | The maximum number of individuals an environment can sustain long-term without degradation. |
| Density-dependent factors | Biotic factors (e.g., competition, predation, disease) that regulate population size. |
| Density-independent factors | Abiotic factors (e.g., weather, natural disasters) that affect populations regardless of density. |
📌Introduction
Population dynamics describe how populations change in size, density, and distribution over time and space. They are influenced by births, deaths, immigration, and emigration. Growth follows predictable patterns such as exponential and logistic models, but real populations are shaped by density-dependent and density-independent factors. Understanding these dynamics is crucial for ecology, conservation, and resource management
📌 Population Growth Models
- Exponential growth: occurs under ideal conditions, producing a J-shaped curve; limited in real ecosystems.
- Logistic growth: incorporates carrying capacity (K), producing an S-shaped curve; more realistic for natural populations.
- Growth rate depends on birth and death rates as well as immigration/emigration.
- Overshooting K can lead to population crashes due to resource depletion.
- Human populations show modified growth due to technology and medicine.
🧠 Examiner Tip: Always link growth models to real examples (e.g., bacterial exponential growth in lab vs logistic growth in wild populations).
📌 Population Density and Regulation
- High densities increase competition for resources, mates, and territory.
- Density-dependent factors (disease, predation, competition) regulate population near K.
- Density-independent factors (storms, droughts) can abruptly reduce populations.
- Allee effect: very low densities reduce survival (difficulty finding mates, cooperative defence loss).
- Regulation ensures populations remain in dynamic equilibrium with resources.
🧬 IA Tips & Guidance: Fieldwork could include quadrat sampling or mark–recapture to estimate population size and density.
📌 Population Distribution Patterns
- Clumped distribution: most common; reflects patchy resources or social behaviour (herds, flocks, schools).
- Uniform distribution: results from territoriality or competition (e.g., nesting seabirds).
- Random distribution: occurs when resources are uniform and interactions minimal.
- Distribution patterns can change with seasons or life stages.
- Spatial distribution affects interactions, survival, and reproduction.
🌐 EE Focus: An EE could analyse population density and distribution in a chosen species, linking to environmental variables and conservation implications.
📌 Human Influence on Population Dynamics
- Habitat destruction reduces carrying capacity.
- Overhunting and exploitation cause population crashes.
- Conservation efforts (wildlife reserves, captive breeding) stabilise endangered species.
- Human populations show unique dynamics due to medical, agricultural, and industrial advances.
- Urbanisation creates high-density environments with distinct ecological challenges.
❤️ CAS Link: Students could organise biodiversity surveys in their school grounds to track insect or plant population densities over time.
🌍 Real-World Connection: Fisheries management depends on understanding logistic growth and avoiding overharvesting beyond sustainable yield.
📌 Interactions Between Populations
- Predator-prey cycles demonstrate population oscillations (e.g., lynx–hare).
- Competition regulates densities through resource limitation.
- Keystone species strongly affect community population structures.
- Populations within ecosystems are never isolated; their dynamics are interdependent.
- Long-term monitoring reveals trends in ecosystem health and resilience.
🔍 TOK Perspective: Population models simplify reality — e.g., J and S curves. TOK issue: To what extent do such mathematical models capture the unpredictability of real ecosystems?