C1.1.2 ENZYME ACTIVITY AND FACTORS AFFECTING IT
📌Definition Table
| Term | Definition |
|---|---|
| Enzyme kinetics | The study of the rates of enzyme-catalyzed reactions. |
| Activation energy | The minimum energy required for a reaction to occur, lowered by enzymes. |
| Optimum conditions | The specific temperature and pH at which an enzyme functions most efficiently. |
| Inhibitor | A molecule that decreases enzyme activity by interfering with substrate binding or catalysis. |
| Competitive inhibition | Inhibition where an inhibitor binds to the active site, blocking substrate binding. |
| Non-competitive inhibition | Inhibition where an inhibitor binds to an allosteric site, altering enzyme conformation and reducing activity. |
| Vmax | The maximum velocity of an enzyme-catalyzed reaction when active sites are saturated. |
| Km (Michaelis constant) | The substrate concentration at which reaction rate is half of Vmax; a measure of enzyme affinity for substrate. |
📌Introduction
Enzyme activity is central to metabolism, as enzymes control the speed of virtually all biochemical reactions. The rate of activity depends on both the enzyme’s structure and environmental conditions. Factors such as temperature, pH, substrate concentration, and the presence of inhibitors or activators influence how efficiently enzymes catalyze reactions. Understanding these effects allows us to explain metabolic adaptation, regulate industrial processes, and design medical therapies.
📌 Enzyme–Substrate Interactions and Reaction Rate
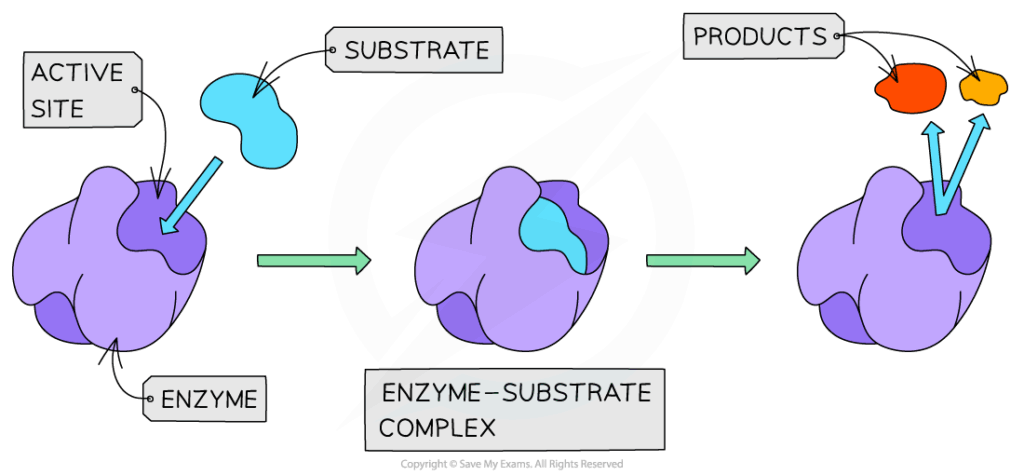
- Enzymes increase reaction rate by stabilizing the transition state and lowering activation energy.
- Reaction rate depends on substrate concentration:
- At low concentrations → rate increases linearly with more substrate.
- At high concentrations → rate levels off as enzymes become saturated (Vmax).
- Km provides a measure of affinity:
- Low Km = high affinity (enzyme effective at low substrate levels).
- High Km = low affinity.
🧠 Examiner Tip: Always draw enzyme activity graphs with proper labeling (x-axis = substrate concentration, y-axis = rate). Mark Vmax and Km clearly for full marks.
📌 Effects of Temperature and pH
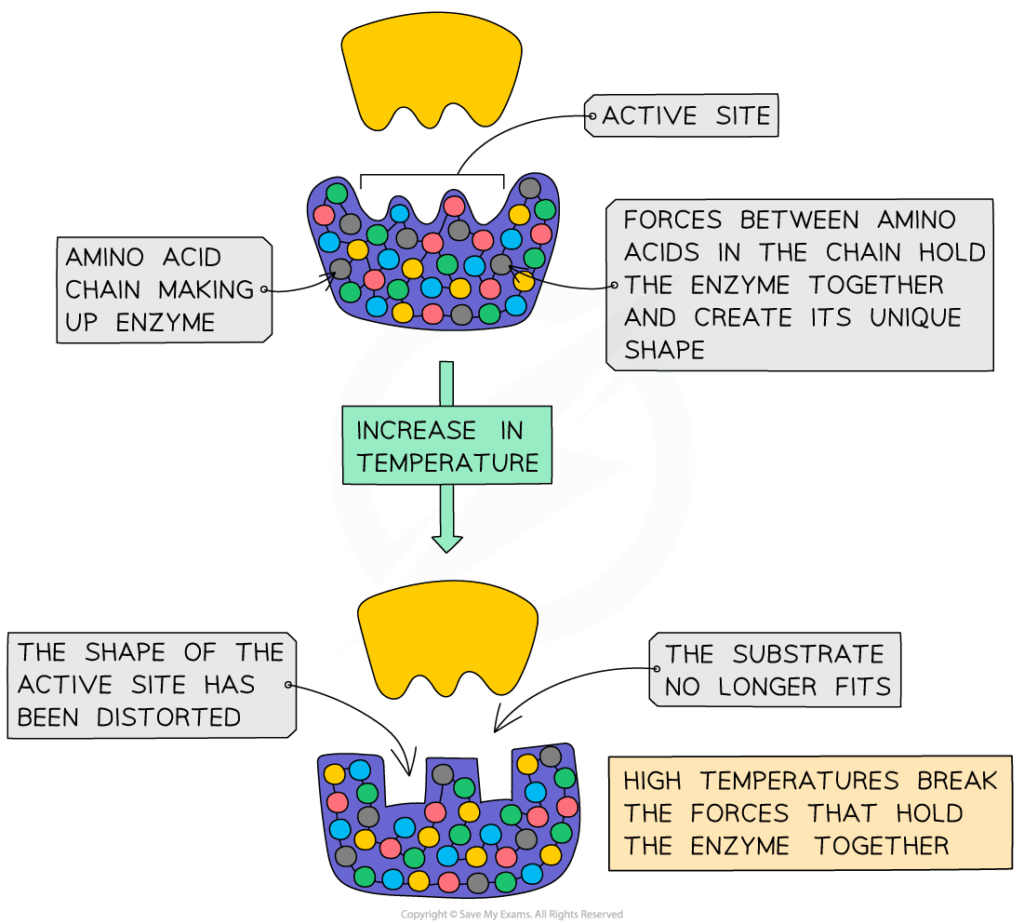
- Temperature:
- Increases kinetic energy → more collisions → faster reaction.
- Past optimum (~37°C in humans), heat disrupts hydrogen bonds, leading to denaturation.
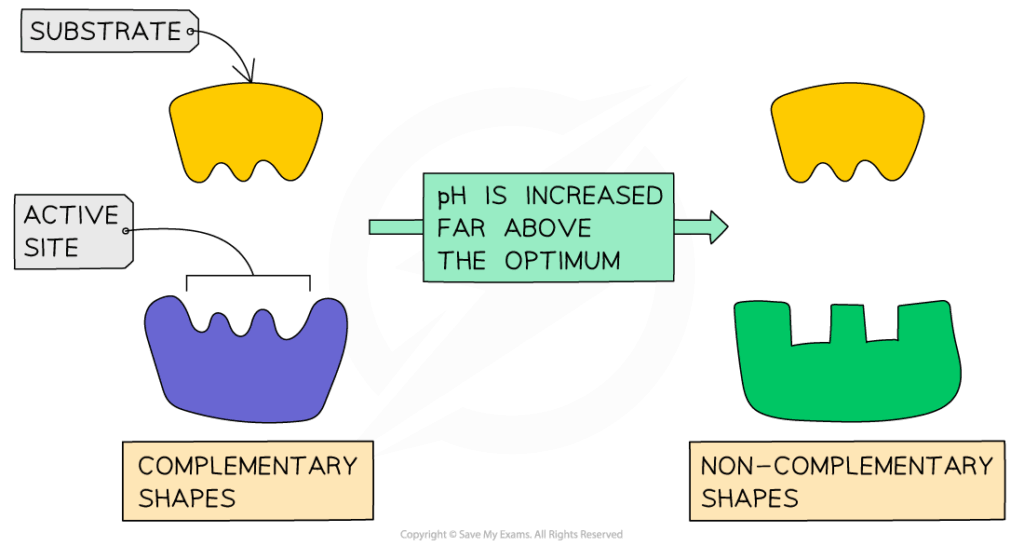
- pH:
- Affects ionization of active site residues and substrate.
- Each enzyme has an optimum pH (e.g., pepsin ~pH 2, trypsin ~pH 8).
- Extreme pH causes denaturation and loss of activity.
🧬 IA Tips & Guidance: Classic IA designs include measuring catalase activity (oxygen release from H₂O₂) under different pH or temperature conditions. Use quantitative data (gas volume, colorimetry, pressure sensors) to strengthen analysis.
📌 Inhibition of Enzymes
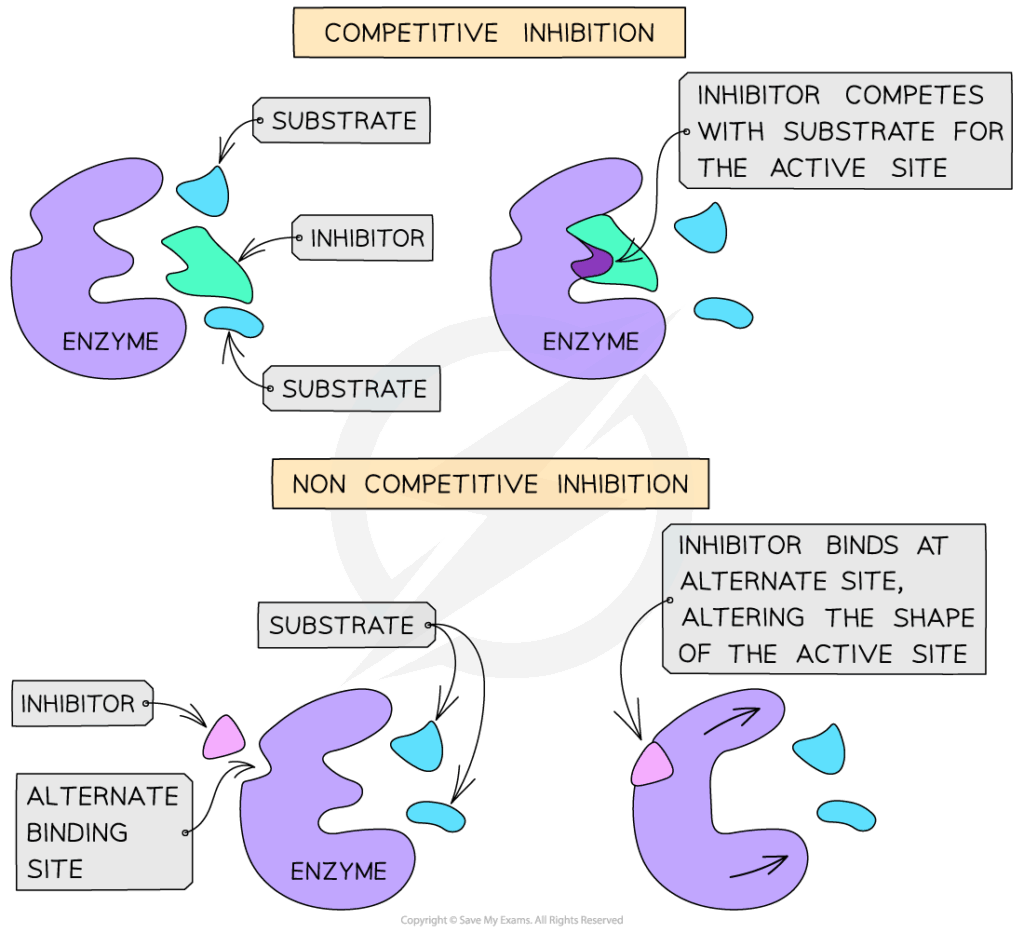
- Competitive inhibition:
- Inhibitor resembles substrate and binds to active site.
- Can be overcome by increasing substrate concentration.
- Example: Malonate inhibiting succinate dehydrogenase.
- Non-competitive inhibition:
- Inhibitor binds to allosteric site, changing enzyme shape.
- Substrate may still bind, but reaction rate is reduced.
- Cannot be overcome by increasing substrate concentration.
- Feedback inhibition:
- End-product of a pathway inhibits an enzyme earlier in the chain.
- Prevents overproduction and conserves resources.
- Example: Isoleucine inhibiting threonine deaminase.
🌐 EE Focus: An EE could explore enzyme inhibition experimentally (e.g., effect of competitive vs non-competitive inhibitors on catalase). Alternatively, computational modeling could investigate how active site mutations affect Km and Vmax.
📌 Other Factors Influencing Enzyme Activity
- Cofactors and coenzymes are often essential for catalysis.
- Enzyme concentration: higher enzyme levels → higher reaction rate until substrate becomes limiting.
- Substrate availability: critical in metabolic control; shortage reduces activity.
- Physical environment: solvents, ionic strength, and crowding in the cytoplasm affect enzyme efficiency.
❤️ CAS Link: Students could design workshops where participants test enzyme activity in household products (detergents with proteases, pineapple juice breaking down gelatin), linking science experiments to real-world applications.
🌍 Real-World Connection:
Knowledge of enzyme activity is applied in medicine (enzyme inhibitors as drugs, e.g., ACE inhibitors for hypertension), food industry (lactase to produce lactose-free milk), and diagnostics (measuring enzyme levels as disease markers). Enzyme stability research is key in biotechnology, where enzymes must function under industrial conditions.
📌 Enzyme Activity Curves and Data Interpretation
- Typical enzyme activity graphs include:
- Substrate concentration vs rate (Michaelis–Menten).
- Temperature vs rate (bell-shaped curve).
- pH vs rate (bell-shaped curve).
- Inhibition curves show differences:
- Competitive → higher Km, same Vmax.
- Non-competitive → same Km, lower Vmax.
🔍 TOK Perspective: Enzyme activity is modeled mathematically (Michaelis–Menten equation). TOK reflection: How far can mathematical models capture biological complexity, and where do they oversimplify reality?